


After Surging by 25% to Multi-Week Highs, Where Is ETH Heading Next? (Ethereum Price Analysis)
Following a significant surge toward the $4K resistance level, Ethereum’s native token has encountered increased selling pressure, resulting in a slight consolidation. The price is expected to fluctuate within a tight range and experience increased volatility before making its next significant move. Technical Analysis By Shayan The Daily Chart The daily chart shows that Ethereum […]
Following a significant surge toward the $4K resistance level, Ethereum’s native token has encountered increased selling pressure, resulting in a slight consolidation.
The price is expected to fluctuate within a tight range and experience increased volatility before making its next significant move.
Technical Analysis
By Shayan
The Daily Chart
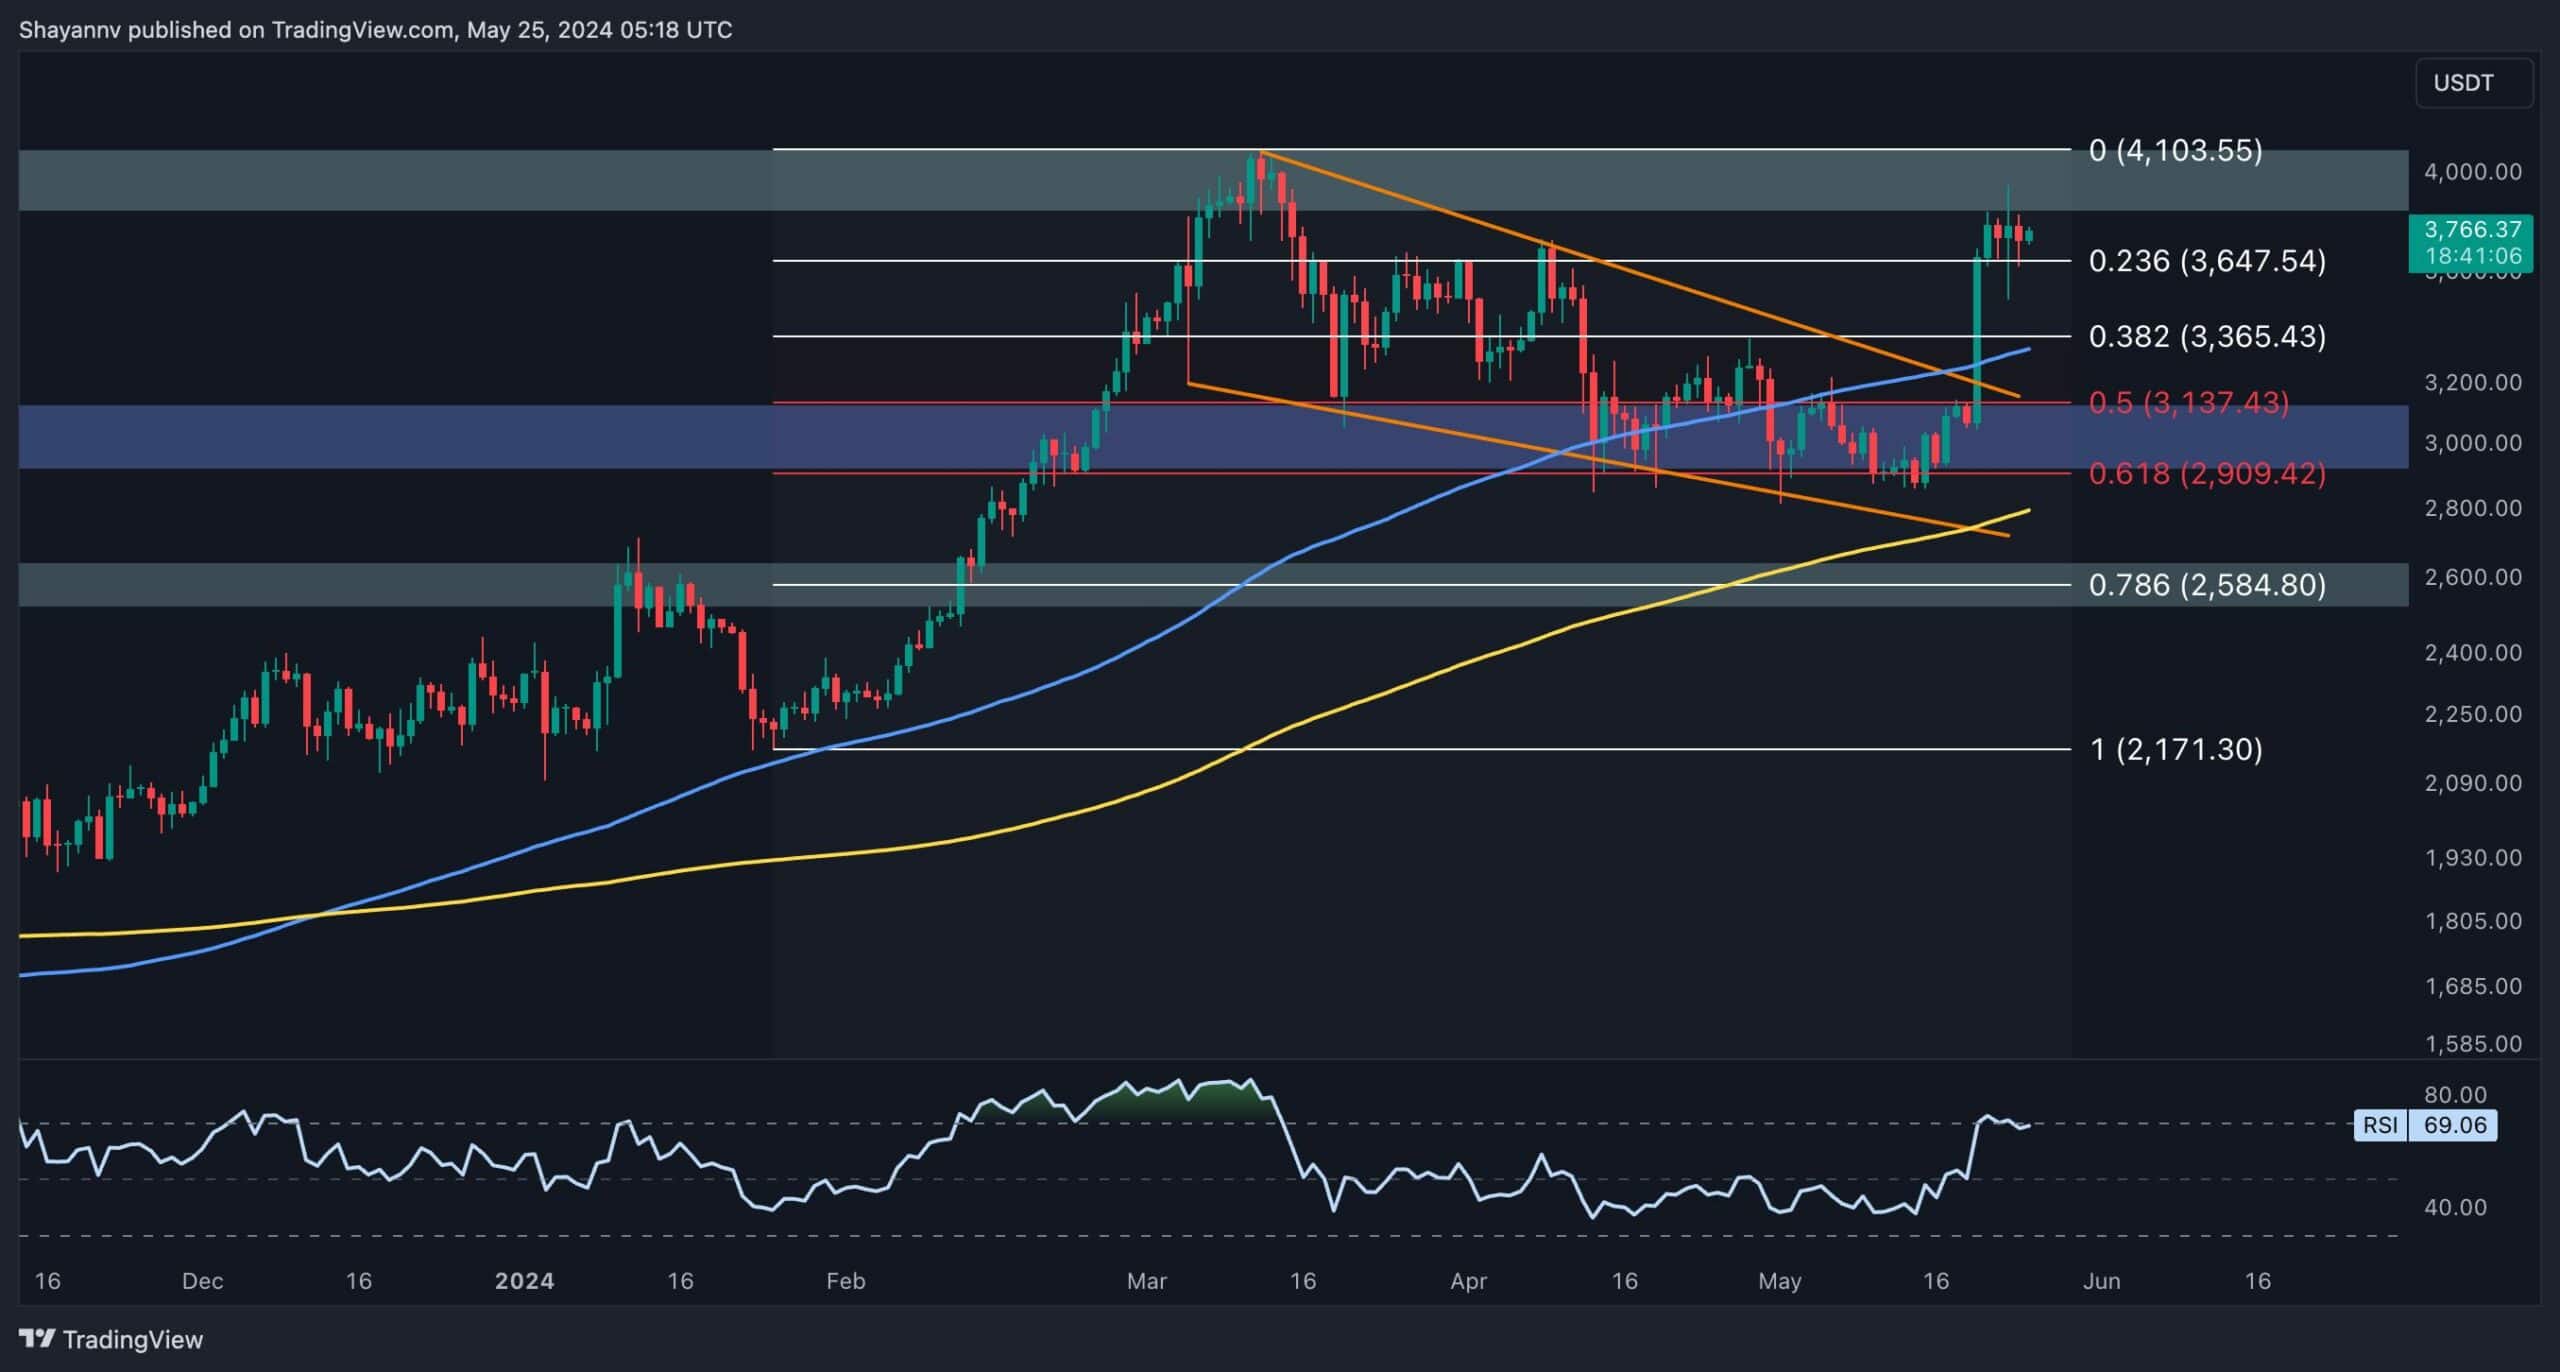
The daily chart shows that Ethereum experienced renewed demand and buying pressure near the critical $3K support level, which aligns with the 0.5 ($3,133) and 0.618 ($2,906) Fibonacci retracement levels. This buying momentum led to a notable upward move, with many short positions being liquidated as the price approached the substantial $4K resistance zone.
However, considerable supply near this pivotal area has increased sales pressure, causing increased volatility and a slight consolidation. A decisive break above this critical resistance could trigger a rally toward the next one at around $4.5K.
Despite this, the current price action indicates the likelihood of a temporary consolidation before the next major move. In this scenario, the 100-day moving average at $3.3K will serve as the primary defense line for buyers in the short term.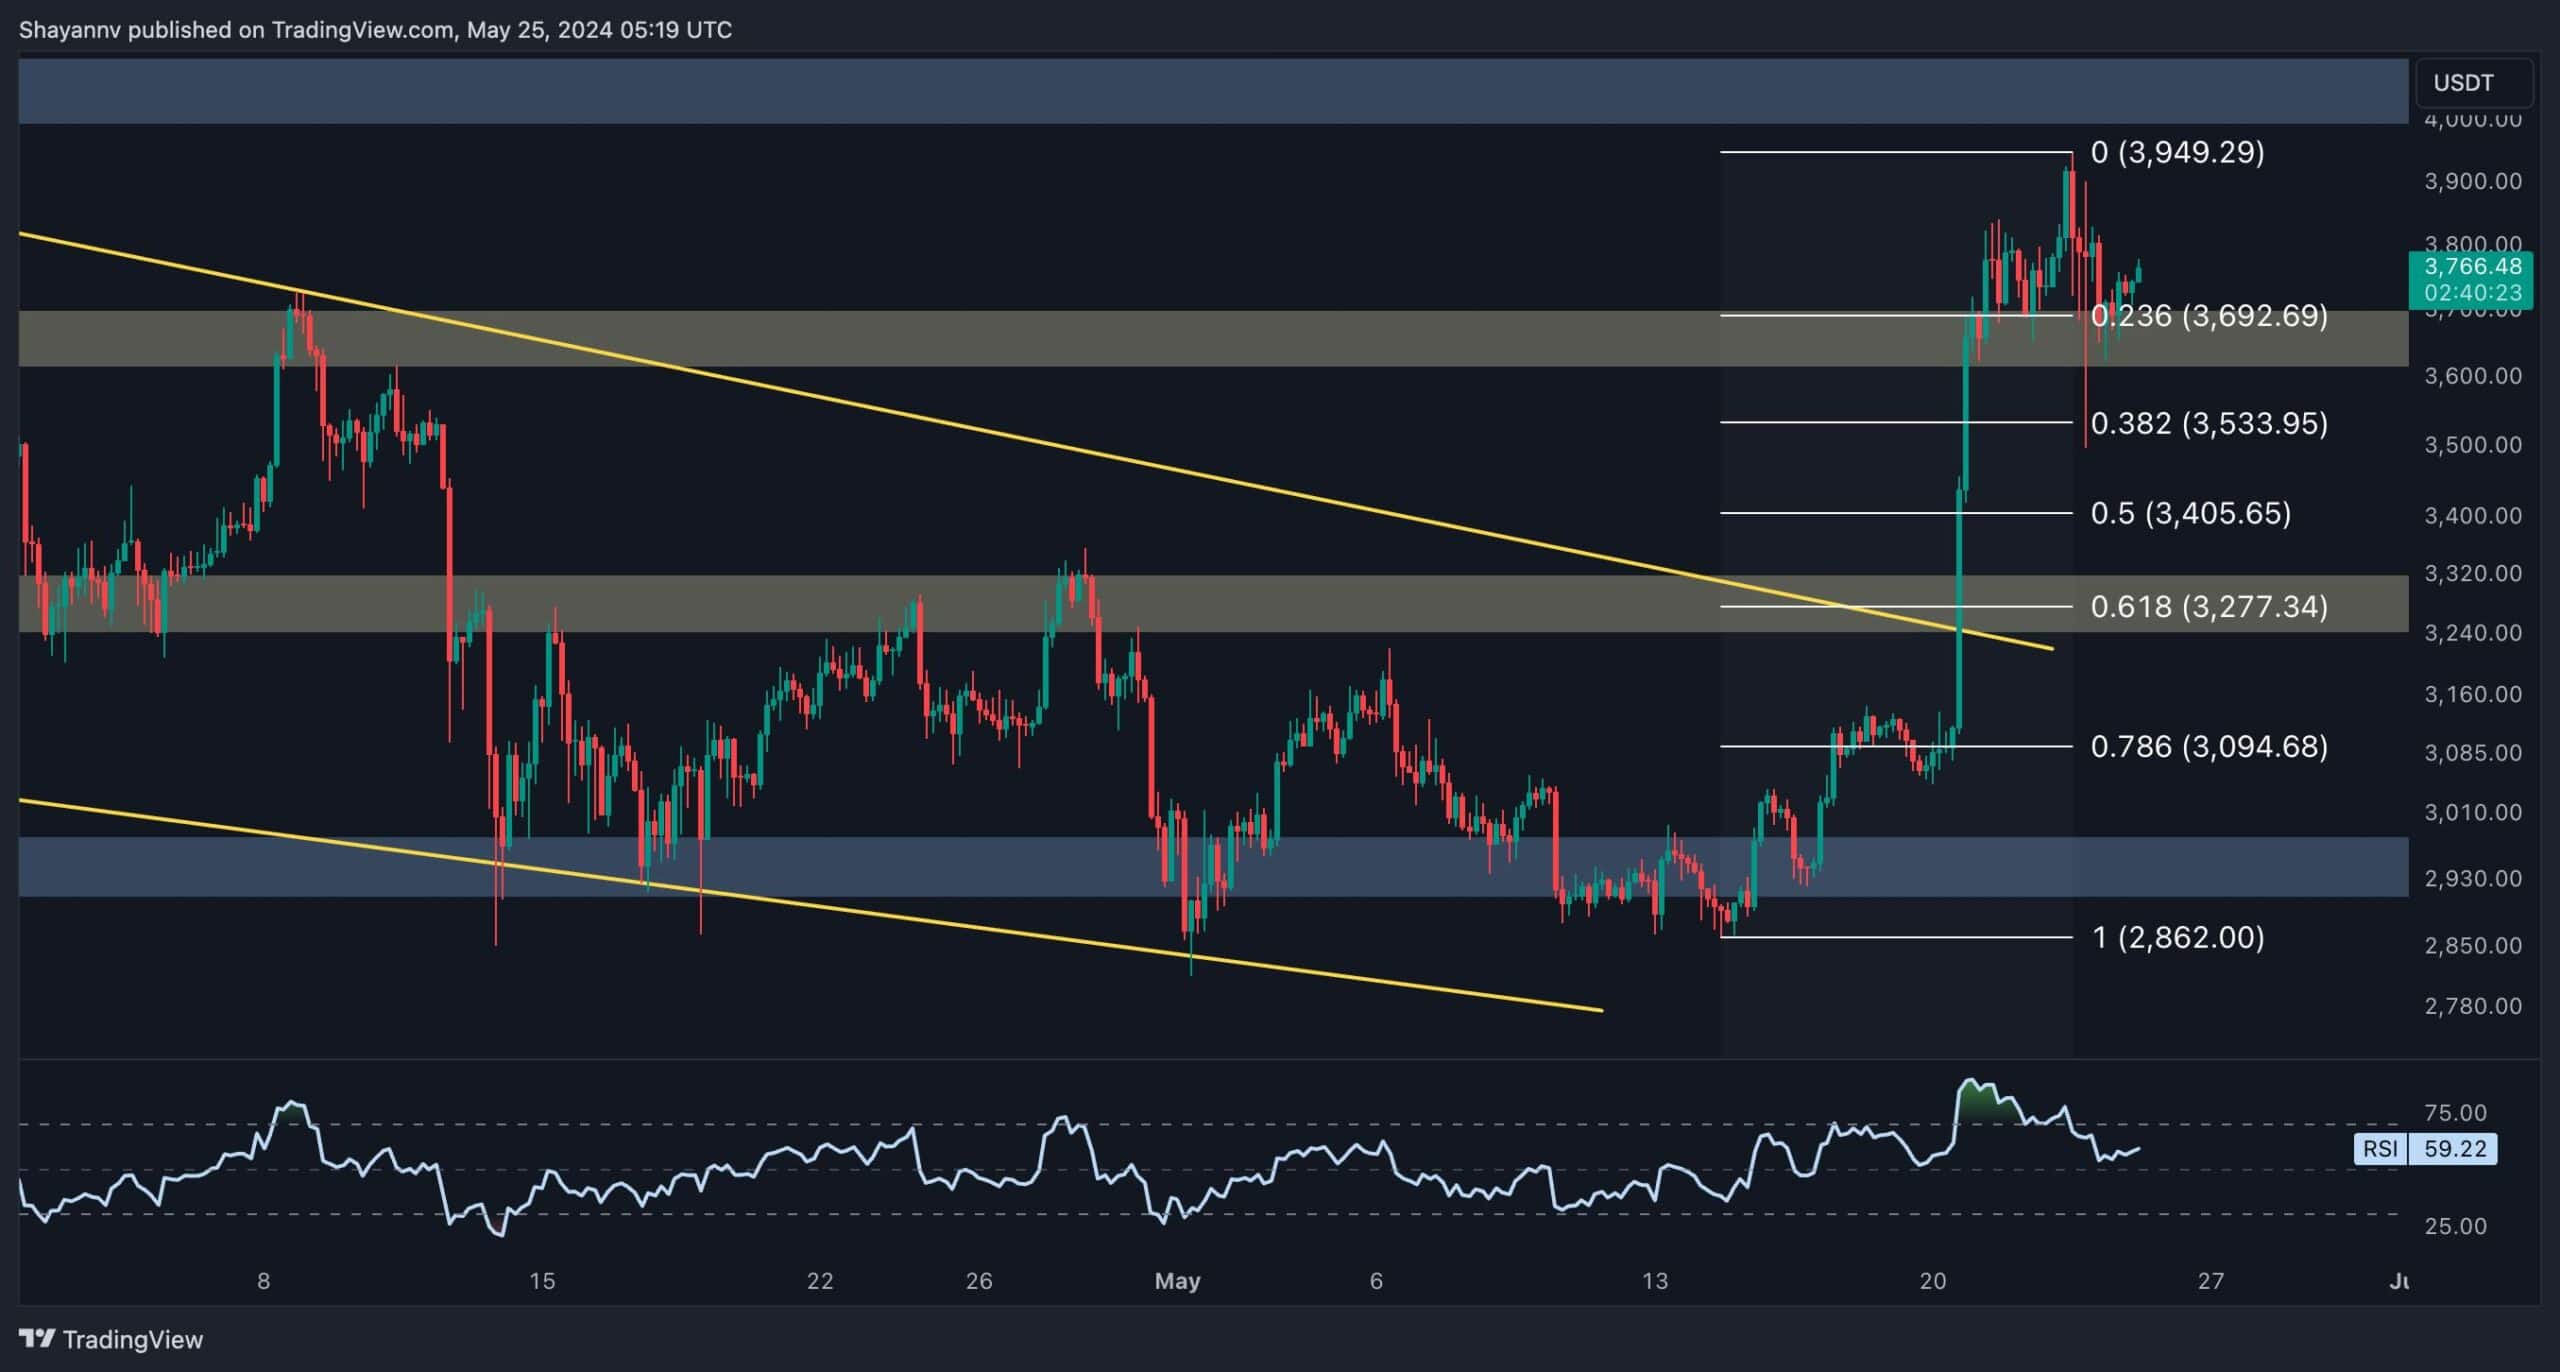
The 4-Hour Chart
The 4-hour chart closely examines ETH’s recent bullish momentum, with the price demonstrating a significant 26% spike and surpassing multiple resistance levels. However, upon reaching the crucial $4K resistance area, the asset experienced increased volatility due to a large liquidation event, reflecting the ongoing battle between buyers and sellers.
Currently, ETH is confined within a significant range, bounded by the $4.1K resistance and the support area between the 0.5 ($3.4K) and 0.618 ($3.2K) Fibonacci levels.
If buyers breach the $4.1K resistance and maintain the bullish momentum, a strong uptrend could develop in the mid-term, potentially aiming for a new all-time high. Nonetheless, a period of sideways consolidation with elevated volatility is likely before the price initiates its next move.
Sentiment Analysis
By Shayan
The perpetual futures market has been a key driver of Ethereum’s price dynamics in recent years. Analyzing futures market metrics can provide valuable insights into predicting future price movements. This chart presents Ethereum’s price alongside Funding Rates, Aggregate Liquidations, and Open Interest metrics.
The chart highlights a significant increase in the open interest metric, which coincides with a notable surge in ETH’s price and positive funding rate values, reaching its highest levels since April 2023. This uptick in open interest indicates heightened activity in the perpetual futures market, with more participants taking aggressive positions. This surge in activity is likely a primary factor behind the recent impulsive price increase.
However, the $4K resistance level holds psychological significance and potential supply, leading to elevated volatility. These fluctuations have resulted in substantial liquidations of both long and short positions, as reflected in the aggregate liquidation metric. Despite this, the overall market sentiment remains bullish, with participants expecting the upward trend to continue.
While the market sentiment is bullish, the price may enter a phase of elevated volatility and sideways consolidation before making its next big move. This temporary consolidation would allow the market to absorb recent gains and set the stage for a potential continuation of the bullish trend.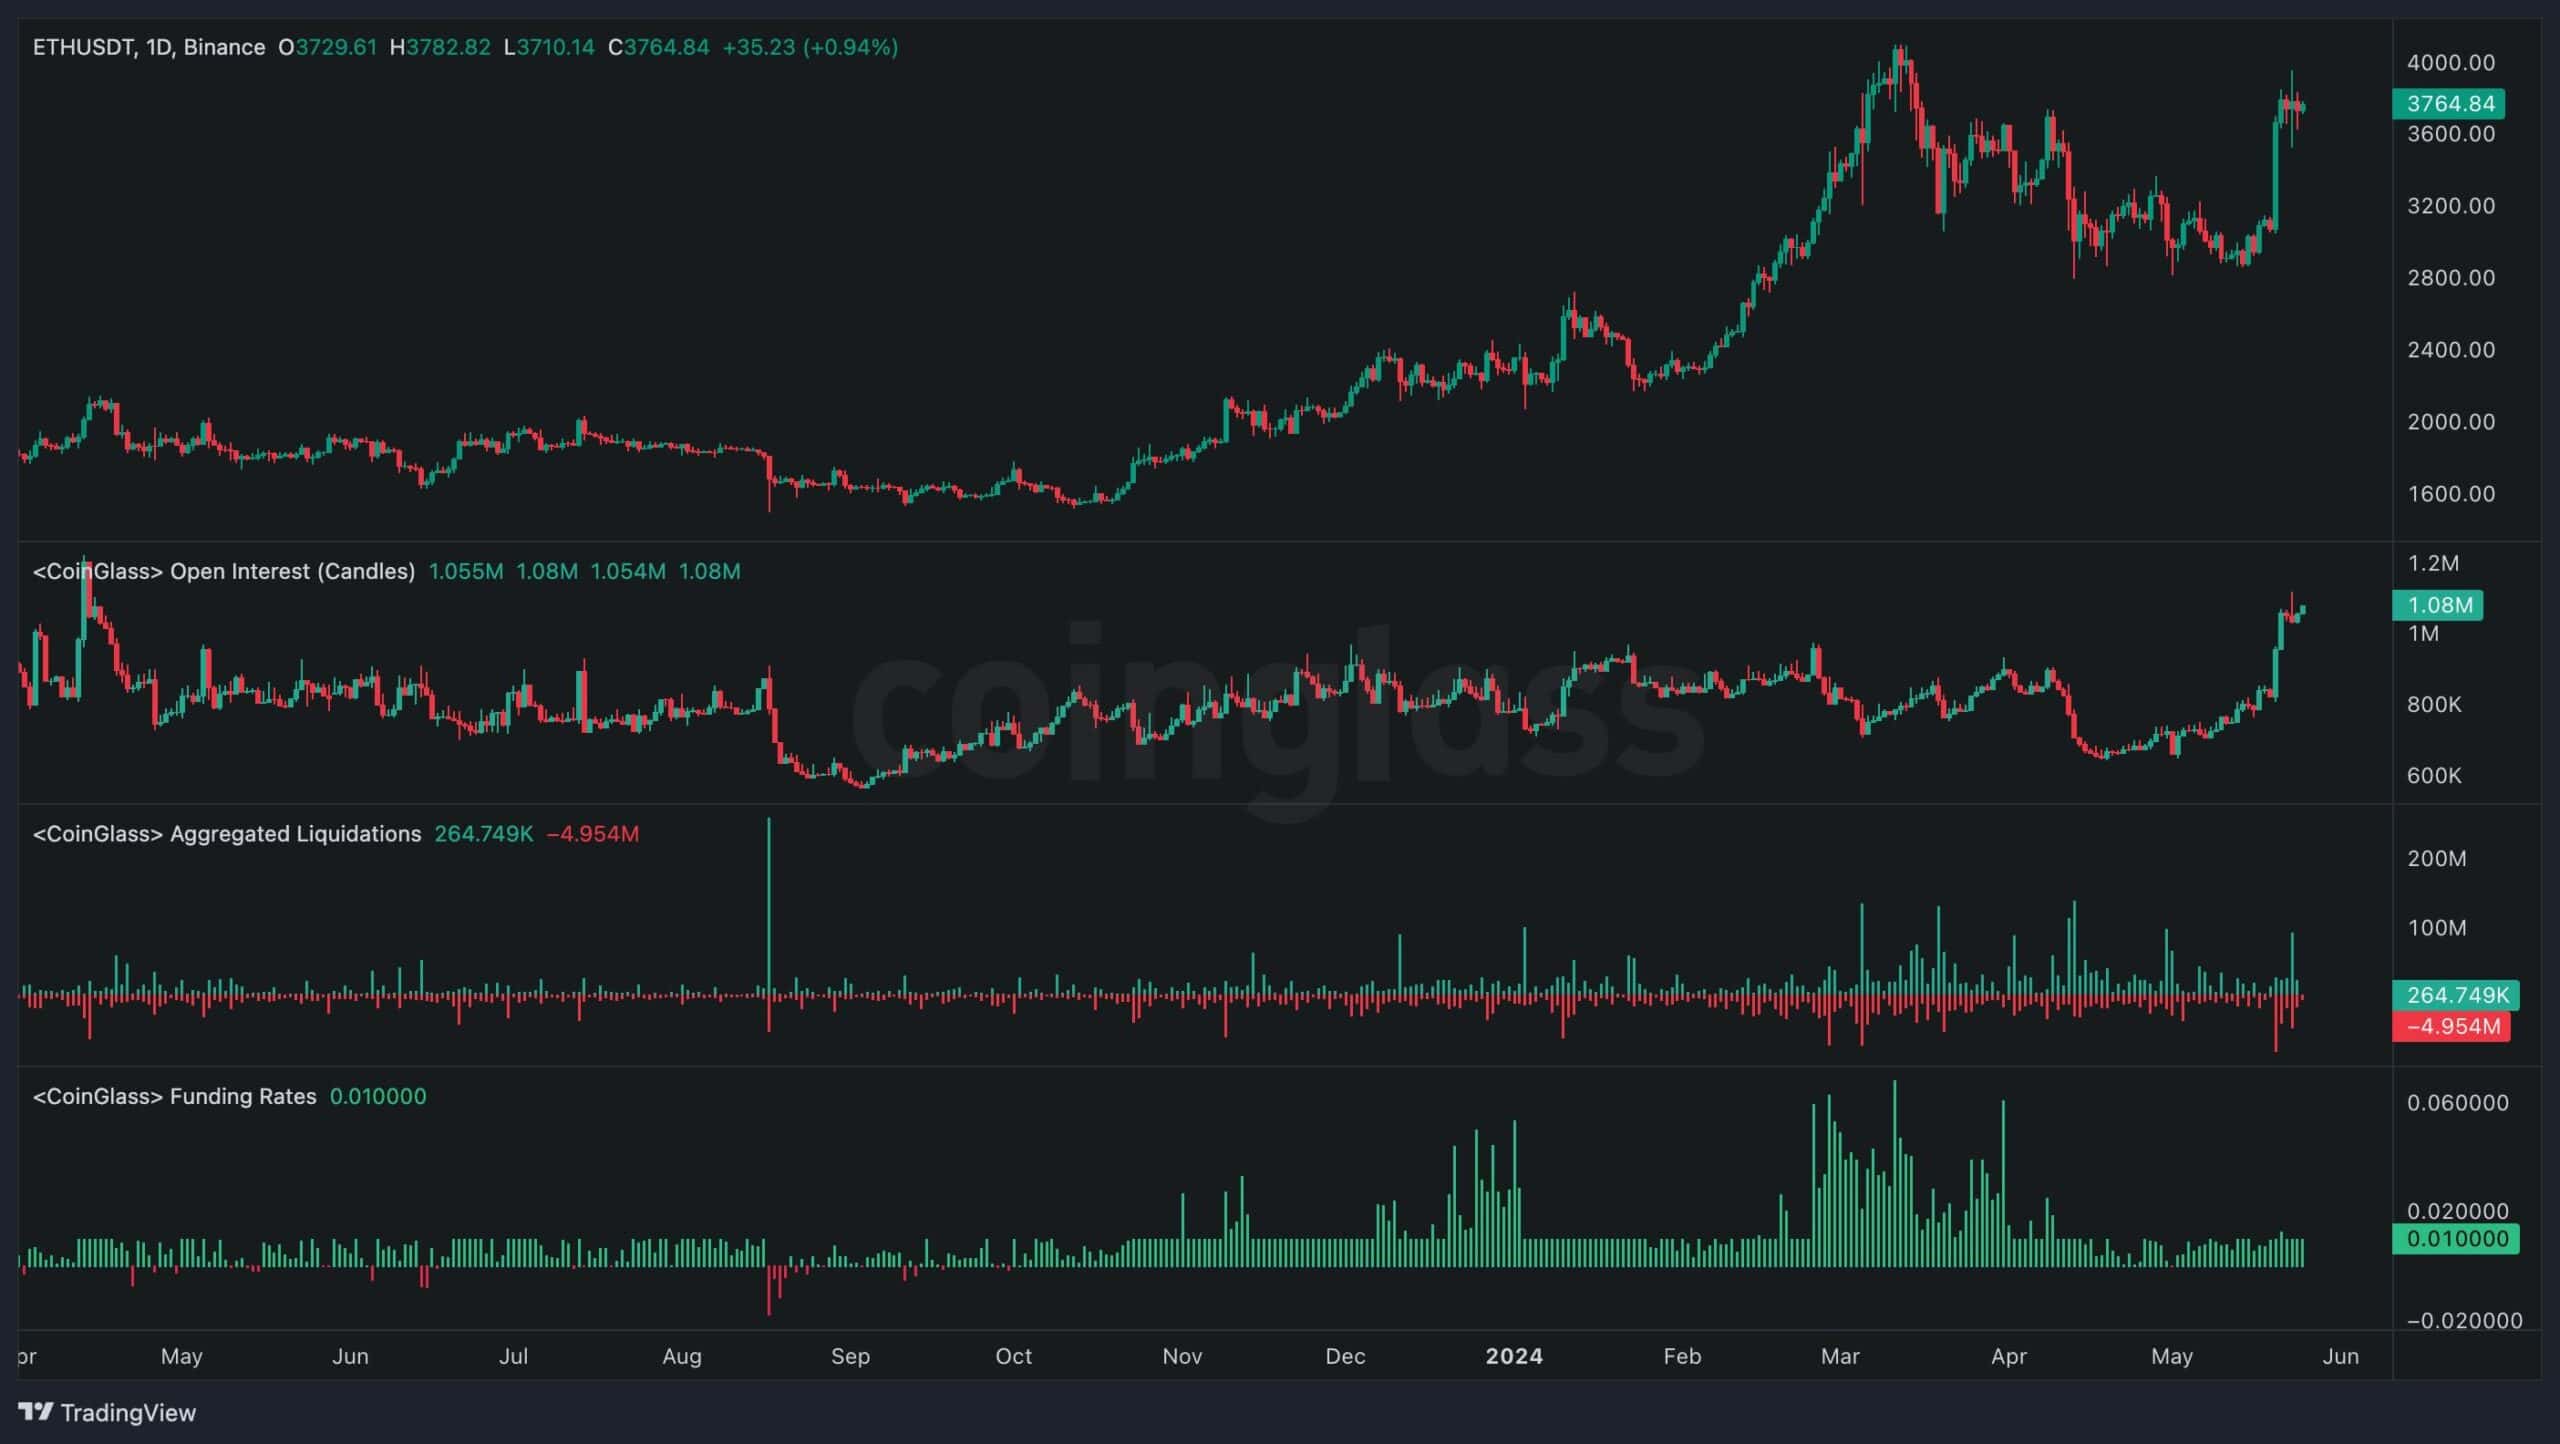
The post After Surging by 25% to Multi-Week Highs, Where Is ETH Heading Next? (Ethereum Price Analysis) appeared first on CryptoPotato.