

DEX Statistics 2026: Volume, Market Share and Perp Data
Decentralized exchanges, or DEXs, let people trade crypto straight from their own wallets. No company holds the funds and no account is needed. Smart contracts handle each trade.
This article gathers the latest DEX statistics from DefiLlama, CoinGecko and other sources. It covers spot volume, perpetual futures volume, market share, blockchains, fees, liquidity and hacks. Each figure carries its time window, because DEX volume changes from week to week.
A quick note on terms. Spot trading means swapping one token for another. Perpetual futures, or perps, let traders take leveraged positions on a price without owning the asset.
Key DEX Statistics at a Glance
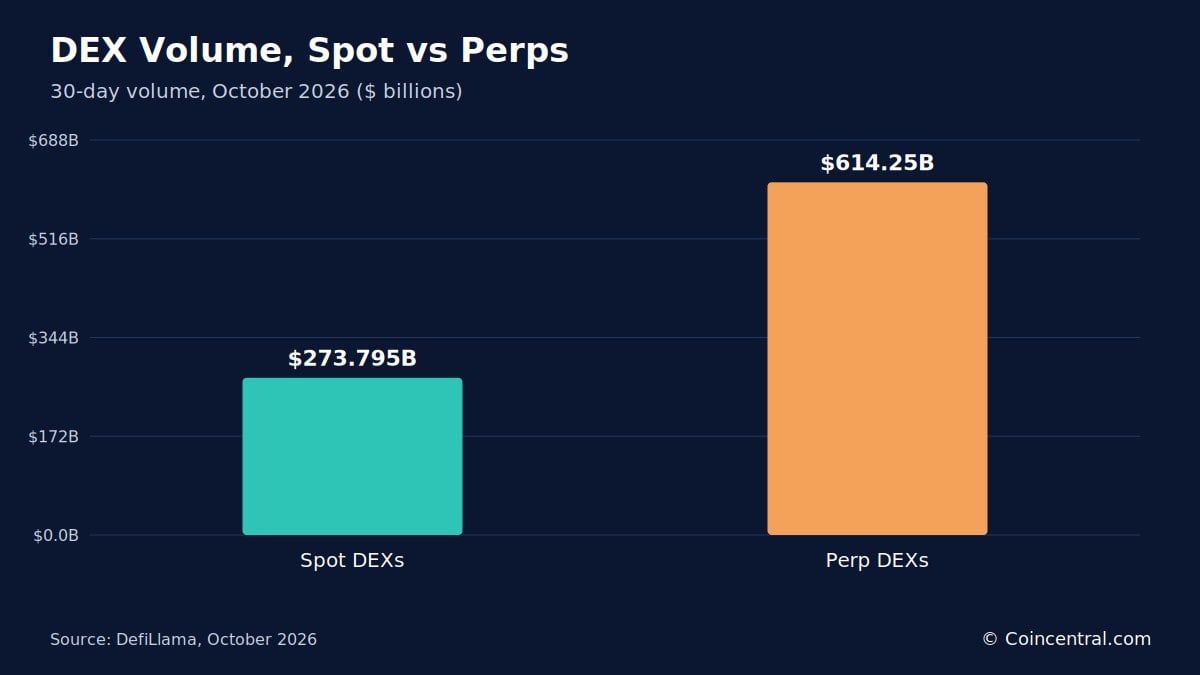
- Spot DEXs processed $273.795 billion over 30 days, while perp DEXs processed $614.25 billion.
- DEX share of spot trading volume rose from 6.9% in January 2024 to 13.6% in January 2026.
- Uniswap took a 41.2% share of top 10 spot DEX volume in the second quarter of 2026.
- Robinhood Chain posted $51.971 billion in 30-day DEX volume, ahead of Ethereum at $42.148 billion.
- Hyperliquid led perp DEXs with $203.285 billion in 30-day volume.
- DEXs hold $14.772 billion in total value locked, which turns over about 18.5 times a month.
DEX Trading Volume: Spot and Perps
Spot DEXs processed $273.795 billion over the last 30 days, according to DefiLlama. The latest 24 hours added $5.72 billion. DefiLlama’s volume coverage spans 810 DEX protocols and 31 centralized exchange venues.
Perp DEXs moved more. They recorded $614.25 billion over 30 days, about 2.2 times the spot figure. In the latest 24 hours, perp volume was $8.821 billion.
The two numbers measure different things. Spot volume counts token swaps, while perp volume counts leveraged exposure. For that reason the totals should not be added together.
| Spot DEX volume, 24 hours | $5.72 billion |
| Spot DEX volume, 30 days | $273.795 billion |
| Perp DEX volume, 24 hours | $8.821 billion |
| Perp DEX volume, 30 days | $614.25 billion |
| Perp open interest | $14.205 billion |
| DEX total value locked | $14.772 billion |
| DEX protocols covered for volume | 810 |
Source: DefiLlama, October 2026
Figure 1: Spot and perp DEX volume over 30 days. Source: DefiLlama, October 2026.Largest DEXs by Trading Volume
Uniswap led 30-day spot volume at $90.95 billion. That is about 33% of the DEX total. PancakeSwap came second with $29.29 billion.
Aerodrome posted $14.207 billion, and Pump posted $12.973 billion. BisonFi recorded $9.559 billion, Raydium $9.443 billion and Meteora $6.49 billion. Tessera V posted $5.921 billion across 4 chains.
Uniswap also led the latest day with $1.905 billion. It runs across 49 chains, while PancakeSwap runs across 12. Uniswap Labs says its protocol has handled more than $4.7 trillion in lifetime volume.
Totals differ between sources because of timing. In June 2026, Changelly put Uniswap at about $73 billion in 30-day volume and PancakeSwap at about $54 billion. Numbers should only be compared when they cover the same date range.
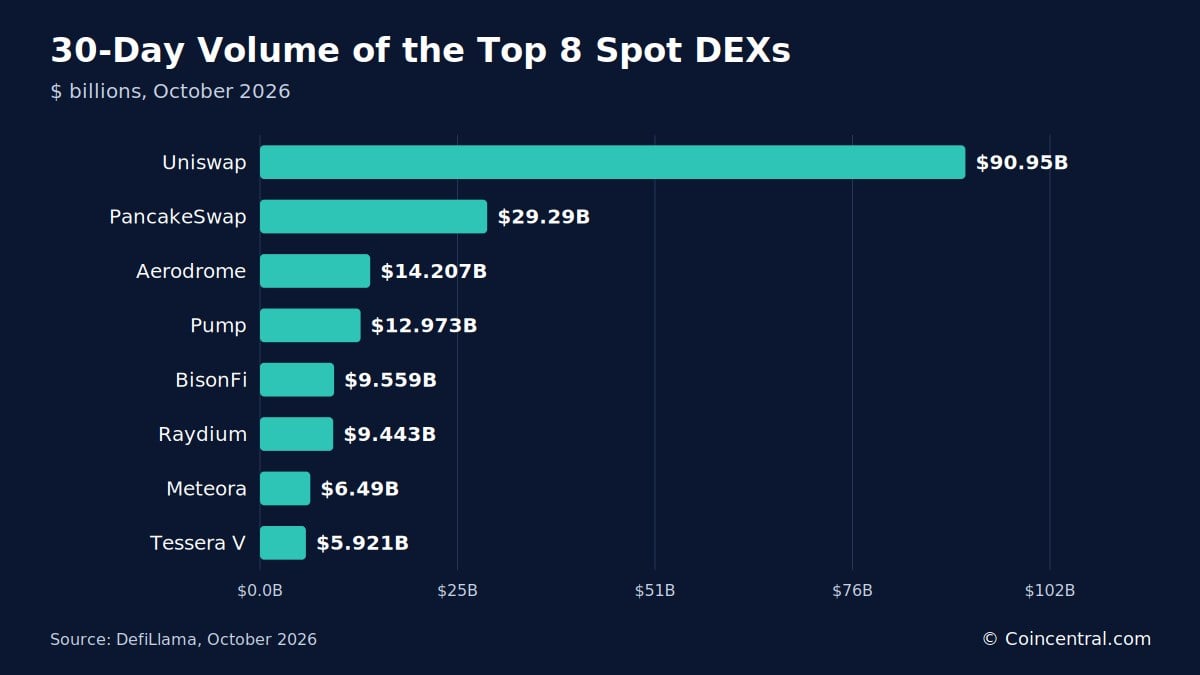 Figure 2: The eight largest spot DEXs by 30-day volume. Source: DefiLlama, October 2026.
DEX Volume in 2026 by Month and Quarter
The top 10 spot DEXs traded $408.9 billion in the second quarter of 2026, according to CoinGecko. That was a 26.5% decline from $556.4 billion in the first quarter.
Monthly volume peaked at $215 billion in January 2026. It fell to $129 billion in May. June recovered slightly to $138 billion.
Aggregate DEX volume by chain fell 29.0% quarter over quarter to $463.2 billion. That drop was wider than the one seen among the top 10 spot DEXs.
| 2026 Q1 | $556.4 billion | Not stated |
| 2026 Q2 | $408.9 billion | Down 26.5% |
| January 2026 | $215 billion | Monthly peak |
| May 2026 | $129 billion | Monthly low reported |
| June 2026 | $138 billion | Slight recovery |
Source: CoinGecko 2026 Q2 Crypto Industry Report
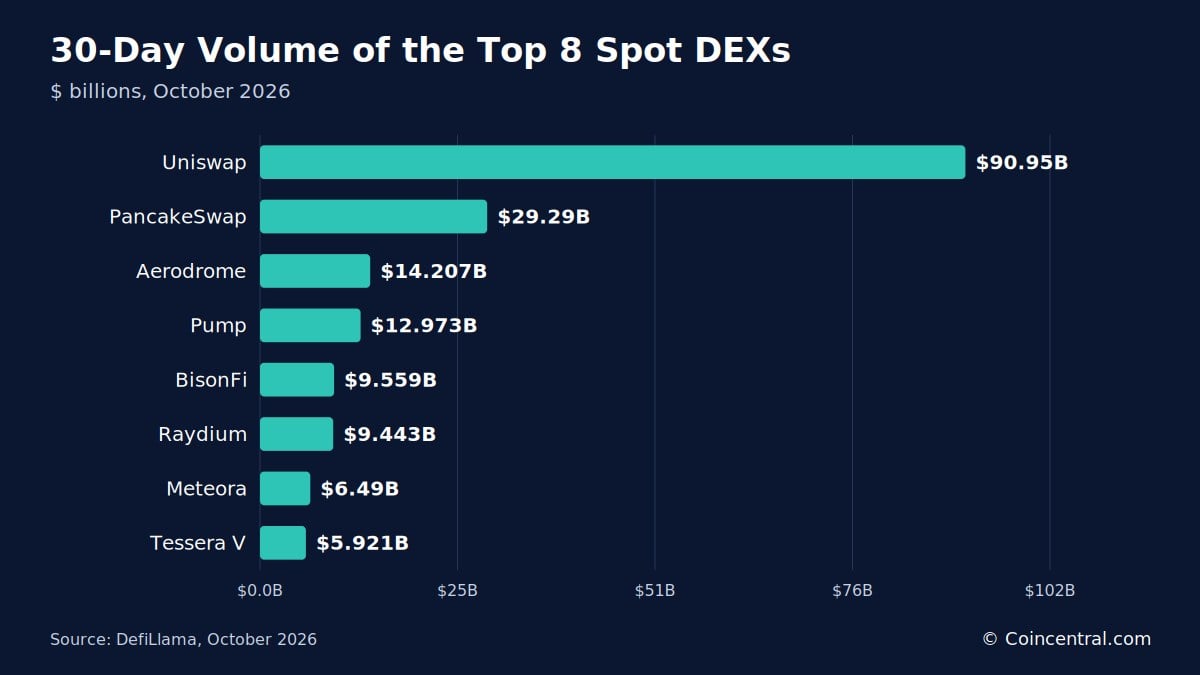 Figure 3: Monthly spot volume across the top 10 DEXs, for the months with reported figures. Source: CoinGecko 2026 Q2 Crypto Industry Report.
DEX vs CEX Market Share
DEXs took a growing share of spot trading over two years. Their share rose from 6.9% in January 2024 to 13.6% in January 2026. Over the same period, spot volume on DEXs more than doubled from $95.86 billion to $231.29 billion.
At its peak in June 2025, DEXs accounted for 24.5% of spot volume. CoinGecko links that peak to Binance Alpha 2.0, which routed trades through PancakeSwap. DEX share has stayed above 10% since January 2025.
CoinGecko says the rise was largely driven by the memecoin boom that began in May 2024. It also reads the steady share above 10% as a sign of a maturing market.
Centralized exchanges, or CEXs, still lead. They kept more than $1 trillion in monthly spot volume, and processed nearly $80 trillion across spot and perps in 2025. The top 10 spot DEX to CEX ratio stood at 23.5% in the second quarter of 2026, up 2.1 percentage points.
Between August 2025 and January 2026, PancakeSwap and Uniswap entered the top 10 spot exchanges, with $0.55 trillion and $0.54 trillion in cumulative volume. That put them ahead of Bitget, OKX, Coinbase and Upbit. Binance led with $3.54 trillion in spot volume and $13.61 trillion in perps volume.
| DEX spot volume | $95.86 billion | $231.29 billion |
| DEX share of spot volume | 6.9% | 13.6% |
| Perp DEX volume | $81.74 billion | $739.48 billion |
| Perp DEX share of perps volume | 2.0% | 10.2% |
| Total perps volume | $4.14 trillion | $7.24 trillion |
Source: CoinGecko CEX and DEX Trading Activity Report 2026
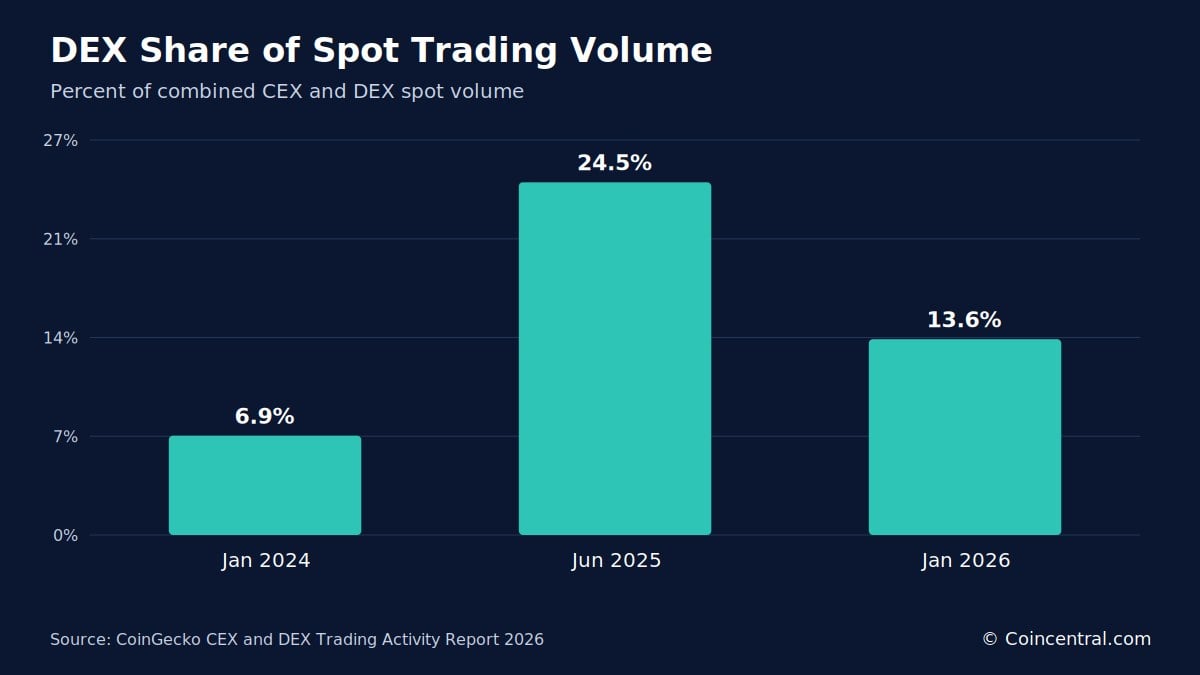 Figure 4: DEX share of spot trading volume at three points in time. Source: CoinGecko CEX and DEX Trading Activity Report 2026.
DEX Market Share by Protocol
Uniswap held a 41.2% share of top 10 spot DEX volume in the second quarter of 2026. Its volume fell 21.4% to $168.5 billion. PancakeSwap stayed second with $80.7 billion, down 34.4%.
Aerodrome grew 33.2% from the first quarter to $44.7 billion, a 10.9% share. Solana prop DEXs such as Humidifi fell 83.0%, and BisonFi fell 47.7%. Hyperliquid entered the top 10 with a 3.7% share.
Uniswap’s share rose in a quarter when total volume fell. CoinLaw reads this as volume gathering at the largest venue when activity cools.
| Uniswap | $168.5 billion | Down 21.4% | 41.2% |
| PancakeSwap | $80.7 billion | Down 34.4% | Not stated |
| Aerodrome | $44.7 billion | Up 33.2% | 10.9% |
| Hyperliquid | Not stated | Not stated | 3.7% |
Source: CoinGecko 2026 Q2 Crypto Industry Report
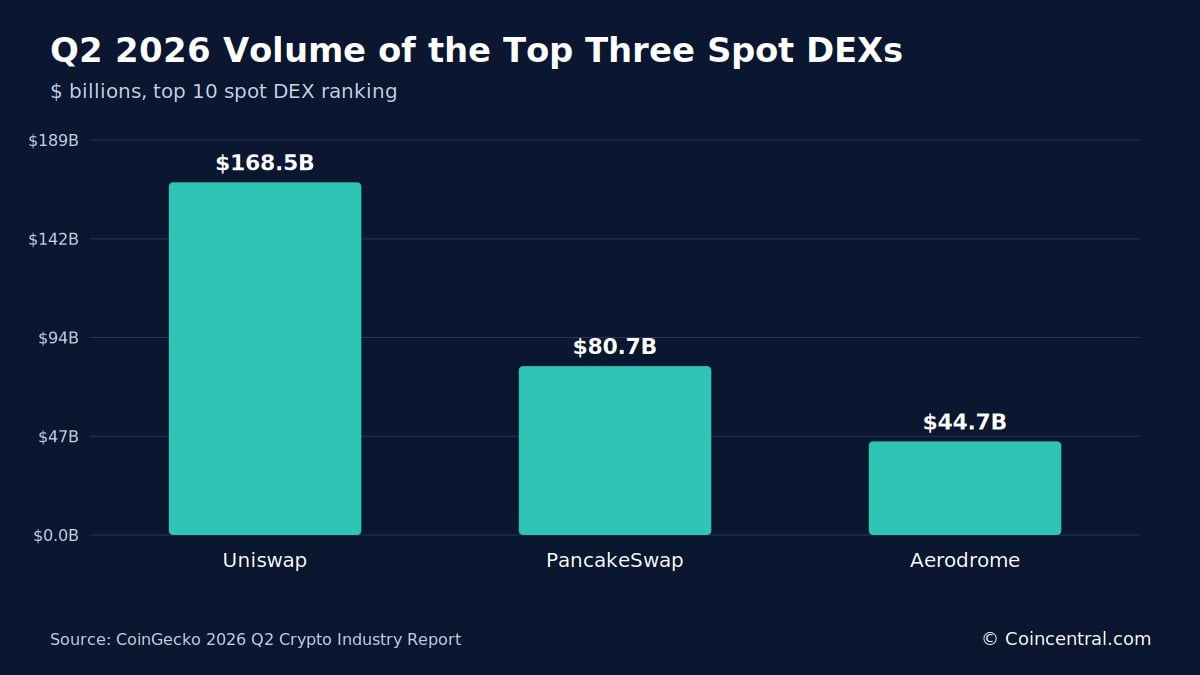 Figure 5: Second quarter 2026 volume for the three largest spot DEXs. Source: CoinGecko 2026 Q2 Crypto Industry Report.
DEX Volume by Blockchain
Solana led 30-day DEX volume at $77.377 billion. Robinhood Chain ranked second at $51.971 billion, ahead of Ethereum at $42.148 billion. BSC and Base followed with $35.027 billion and $29.147 billion.
DefiLlama tracks DEX volume on 294 chains. This means Ethereum-only rankings leave out a large share of swap activity.
The quarterly picture is different. Ethereum reclaimed first place in the second quarter of 2026 with a 27.2% share. Solana fell 43.9% to $103.9 billion and slipped to third at 22.4%.
Base dropped 6.4% to $70.6 billion, a 15.2% share. Hyperliquid was the only chain in the top 10 to grow, up 2.2% from the first quarter.
| Ethereum | 27.2% | Not stated | Reclaimed first place |
| Solana | 22.4% | $103.9 billion | Down 43.9% |
| Base | 15.2% | $70.6 billion | Down 6.4% |
| Hyperliquid | Not stated | Not stated | Up 2.2% |
Source: CoinGecko 2026 Q2 Crypto Industry Report
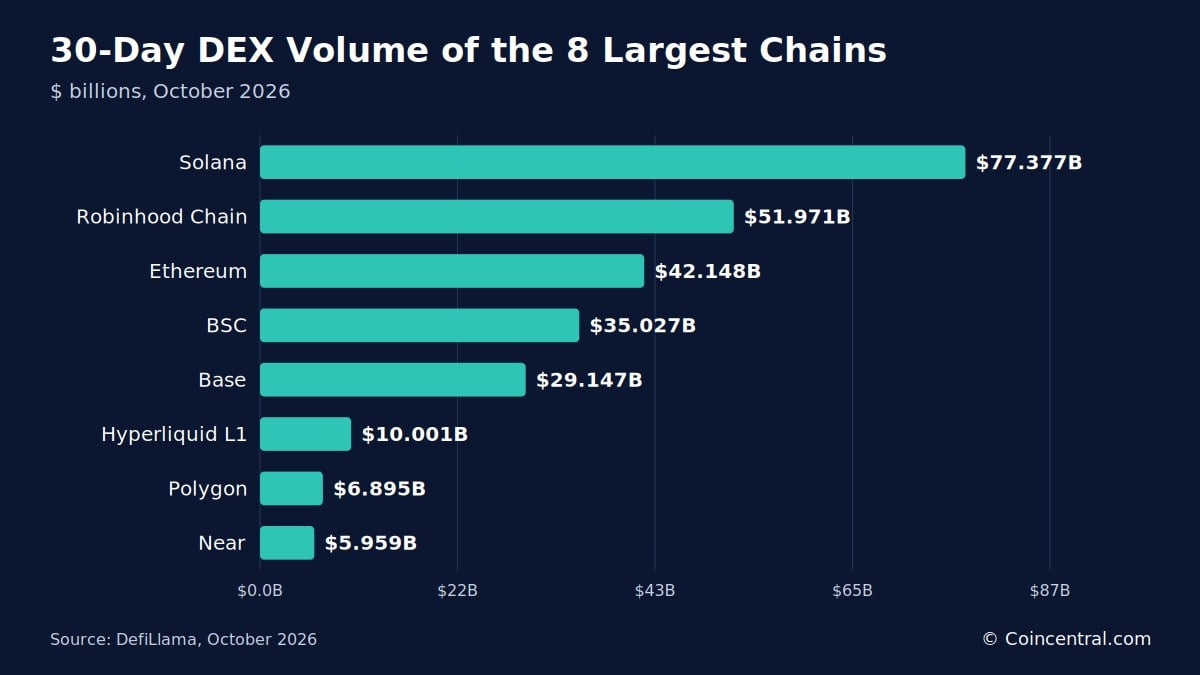 Figure 6: DEX volume by blockchain over 30 days. Source: DefiLlama, October 2026.
Perpetual DEX Statistics
Hyperliquid led 30-day perp volume at $203.285 billion, about 33% of the perp DEX total. Aster and Variational followed with $63.396 billion and $63.061 billion. Lighter posted $55.099 billion, edgeX $35.326 billion, and GMX $25.643 billion across 5 chains.
Volume among the top 12 perp DEXs fell 16.7%, from $2.0 trillion in the first quarter of 2026 to $1.7 trillion in the second. The biggest monthly drop came between March and April, from $605.7 billion to $505.1 billion. Volume returned above $600 billion in June.
Hyperliquid’s volume share climbed above 40% in June, the first time since September 2025. Aster was the only other top 12 perp DEX with more than a 10% share in the second quarter.
Over two years, perp DEX volume grew 8-fold, from $81.74 billion to $739.48 billion. Their share of all perps volume went from 2.0% to 10.2%. CoinGecko points to the Hyperliquid airdrop in November 2024, and then the launch of Lighter and Aster, as drivers of the recovery.
Other sources use different methods. Quantumrun reports perp DEX volume of $6.7 trillion in 2025, up 346% from $1.5 trillion in 2024, with Hyperliquid at $2.9 trillion. It also puts the DEX to CEX perp ratio at 18.7%, up from 6.3%, which differs from CoinGecko’s 10.2% share.
Perp DEX Open Interest
Open interest is the value of positions still open. Hyperliquid carried $8.267 billion, about 58% of the $14.205 billion tracked. Aster held $1.395 billion and Variational $1.076 billion.
Open interest on the top 12 perp DEXs grew 13.2%, from $12.4 billion on April 1, 2026 to $14.0 billion on July 1. Hyperliquid’s rose from $7.3 billion to $9.3 billion. Traditional finance assets made up 3.8% of its open interest on January 1 and 21.0% by July 1, led by equities at 12.4%.
| Hyperliquid | $8.267 billion | About 58% |
| Aster | $1.395 billion | About 9.8% |
| Variational | $1.076 billion | About 7.6% |
| All tracked venues | $14.205 billion | 100% |
Source: DefiLlama, October 2026. Shares for Aster and Variational are calculated from the figures shown.
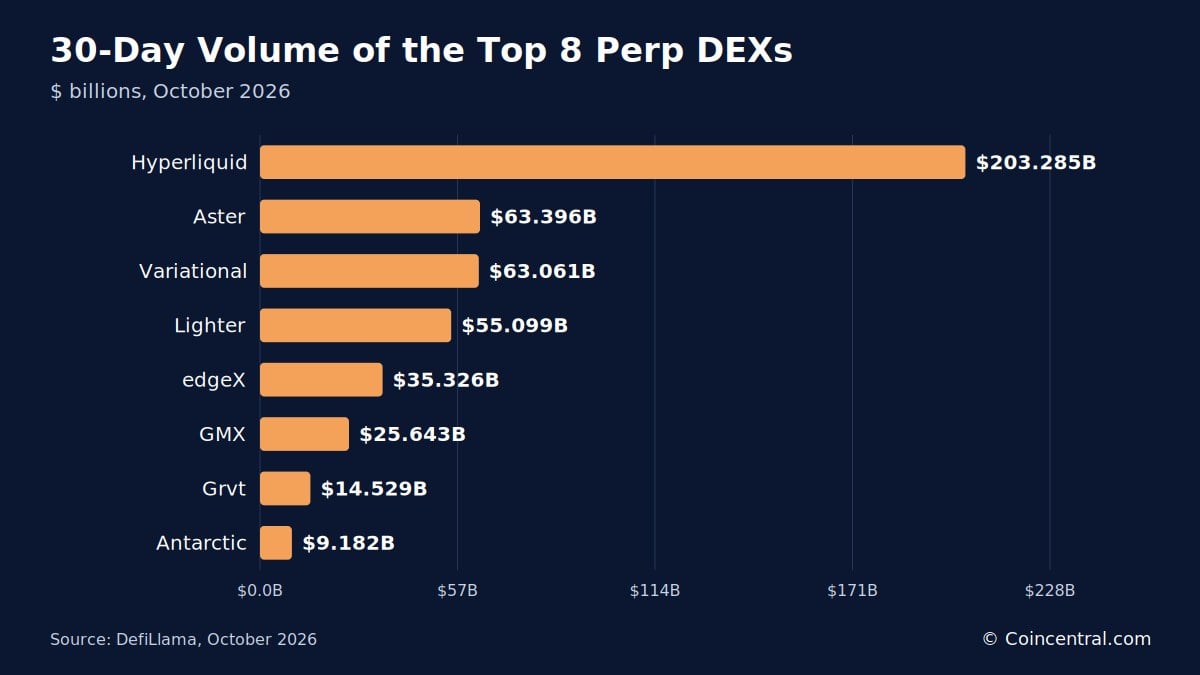 Figure 7: The eight largest perp DEXs by 30-day volume. Source: DefiLlama, October 2026.
DEX Aggregator Statistics
Aggregators route a trade across many pools to find a better price. Jupiter routed $14.79 billion over 30 days. DFlow routed $9.553 billion and 0x Protocol $9.469 billion.
OKX DEX routed $7.748 billion and KyberSwap $7.74 billion. 1inch routed $2.924 billion across 19 chains. 0x Protocol operates across 27 chains, and OKX DEX across 35.
Aggregators routed $2.305 billion in the latest 24 hours. Their volume overlaps with DEX volume, because an aggregator sends orders into the same pools. The two should never be summed.
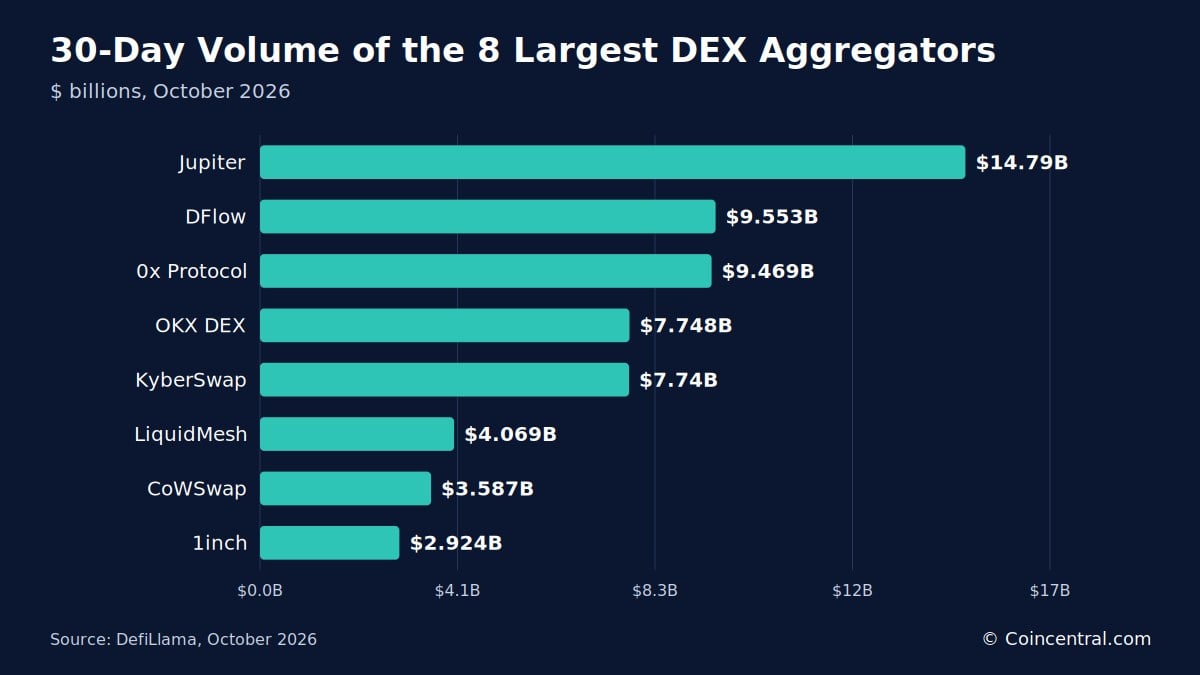 Figure 8: Aggregator volume over 30 days. Source: DefiLlama, October 2026.
DEX Liquidity and TVL
DEXs hold $14.772 billion in total value locked, or TVL, across 2,130 protocols. DEX TVL rose 14.09% over the past month. Against 30-day spot volume, that liquidity turned over about 18.5 times.
DEXs generated $1.44 million in combined 24-hour revenue. That figure measures something different from the fee totals in the next section.
Other DeFi categories hold far more. Liquid staking leads at $61.305 billion, followed by bridges at $60.875 billion and lending at $55.004 billion.
For wider context, Quantumrun reports that cross-chain DeFi TVL peaked at $171.9 billion in early October 2025. It says Ethereum held 68% of that total. It also says real world asset protocols passed $17 billion in TVL in December 2025, overtaking DEXs as the fifth-largest DeFi category.
| Liquid staking | $61.305 billion |
| Bridge | $60.875 billion |
| Lending | $55.004 billion |
| Staking pool | $15.898 billion |
| DEXs | $14.772 billion |
Source: DefiLlama, October 2026
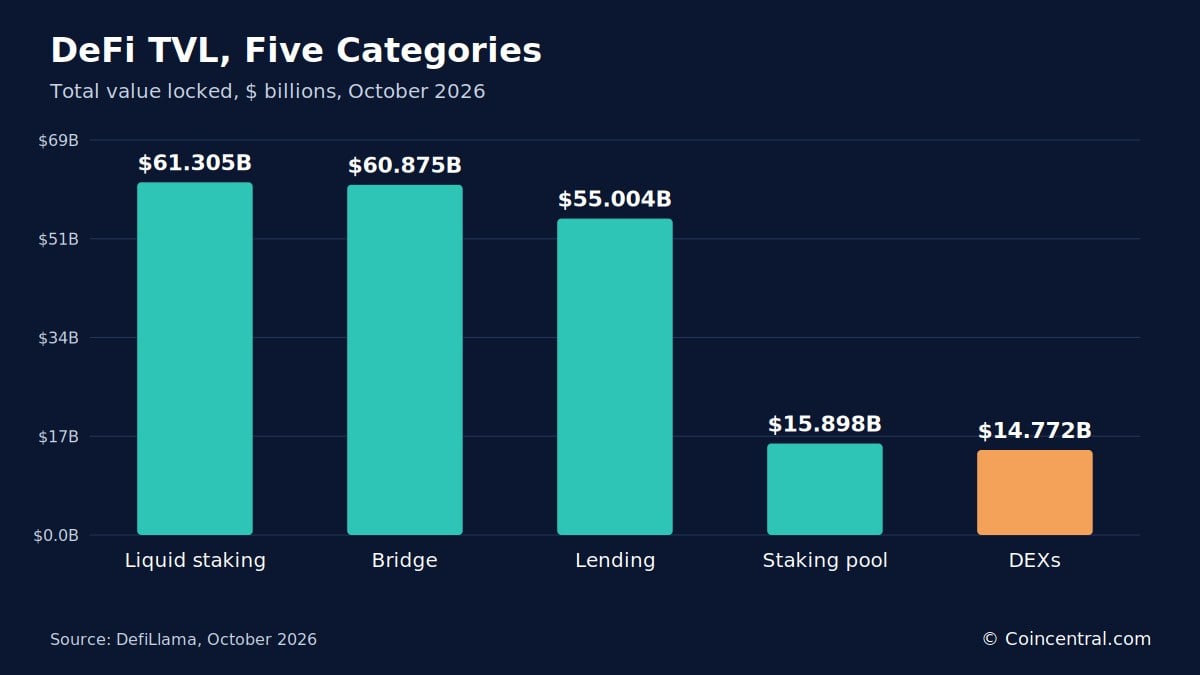 Figure 9: Total value locked in five DeFi categories. Source: DefiLlama, October 2026.
DEX Fees and Revenue
Uniswap collected $182.94 million in 30-day fees, about 0.2% of its 30-day volume. Pump recorded $172.67 million, about 1.3% of its volume. Meteora took in $33.23 million.
Pump’s fee line also counts bonding-curve and terminal fees, so its rate is not a like-for-like swap fee. All protocols on DefiLlama’s fees dashboard generated $65.87 million in 24 hours and $2.456 billion over 30 days.
| Uniswap | $3.82 million | $31.17 million | $182.94 million |
| Pump | $7.16 million | $51.33 million | $172.67 million |
| Meteora | $1.1 million | $7.28 million | $33.23 million |
Source: DefiLlama, October 2026
DEXs earn through swap fees. Uniswap pools charge from 0.01% to 1%, and V1 and V2 users pay 0.3%. According to CryptoSlate, Uniswap Labs removed its interface fee in December 2025.
PumpSwap splits each trade into LP fees of 0.20%, protocol fees of 0.05% and coin creator fees of 0.05%. A standard Pump bonding-curve trade costs 1.25%. On September 23, 2026, PancakeSwap began paying liquidity providers 90% of trading fees in its Infinity pools on Robinhood Chain and keeping 10%.
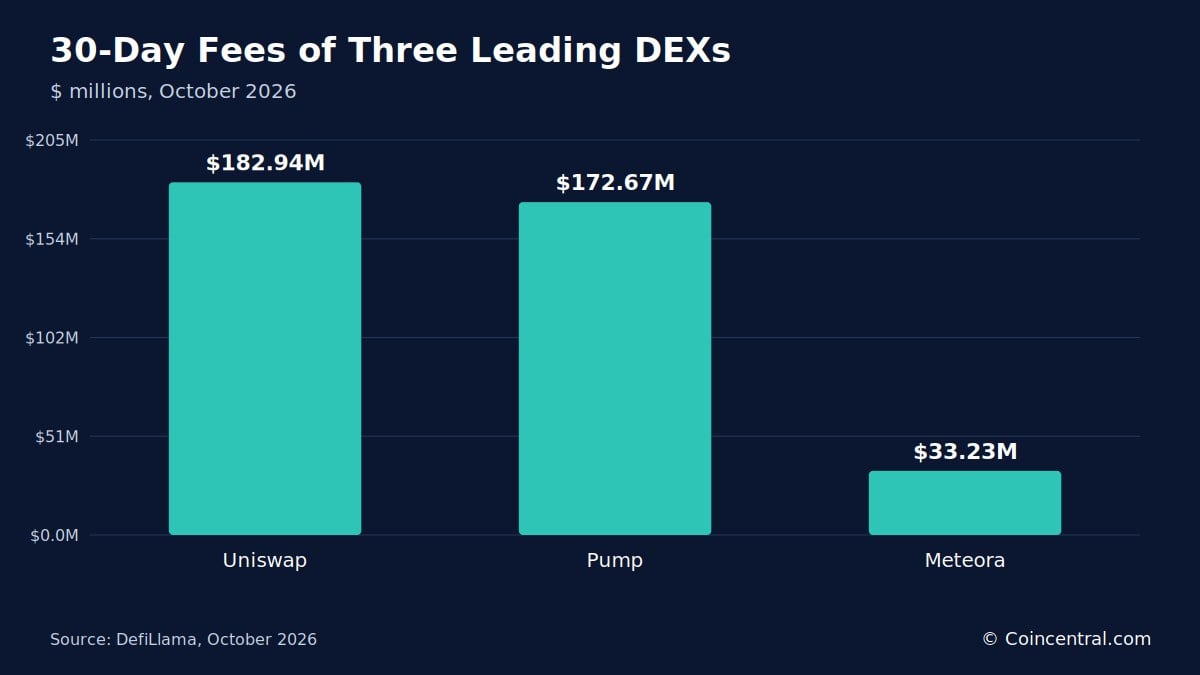 Figure 10: Fees collected over 30 days by Uniswap, Pump and Meteora. Source: DefiLlama, October 2026.
DEX Security and Hack Statistics
DefiLlama records $21.065 billion in total value hacked across crypto. Of that, $9.275 billion came from DeFi and $3.69 billion from bridges.
CoinGecko looked at exchange losses over a little more than a year. CEXs lost well over $2.0 billion to hacks and exploits, and 71% of that came from the Bybit hack in February 2025. Total exchange losses came to over $2.4 billion.
The five largest DEX heists made up just 20.9% of the top CEX hacks. The largest single DEX attack cost $223 million. Compromised private keys were the most common point of failure, while smart contract flaws were the most dangerous vector for DEXs.
Losses still happen on both sides. Bitget lost $387 million in a hot wallet key compromise on September 24, 2026. In July 2023, Curve pools lost about $70 million because of a bug in a software compiler, and most of the money was later returned.
Quantumrun reports that DeFi protocols lost $1.3 billion to exploits in 2024. Smart contract errors accounted for 74% of 85 documented incidents. Uniswap Labs says its protocol has handled more than $4.7 trillion in volume with zero hacks.
| Total value hacked, all crypto | $21.065 billion |
| Total value hacked, DeFi | $9.275 billion |
| Total value hacked, bridges | $3.69 billion |
| Largest DEX attack in CoinGecko’s sample | $223 million |
| Top 5 DEX heists vs top CEX hacks | 20.9% |
| Bitget hot wallet loss, September 2026 | $387 million |
Sources: DefiLlama, CoinGecko, October 2026
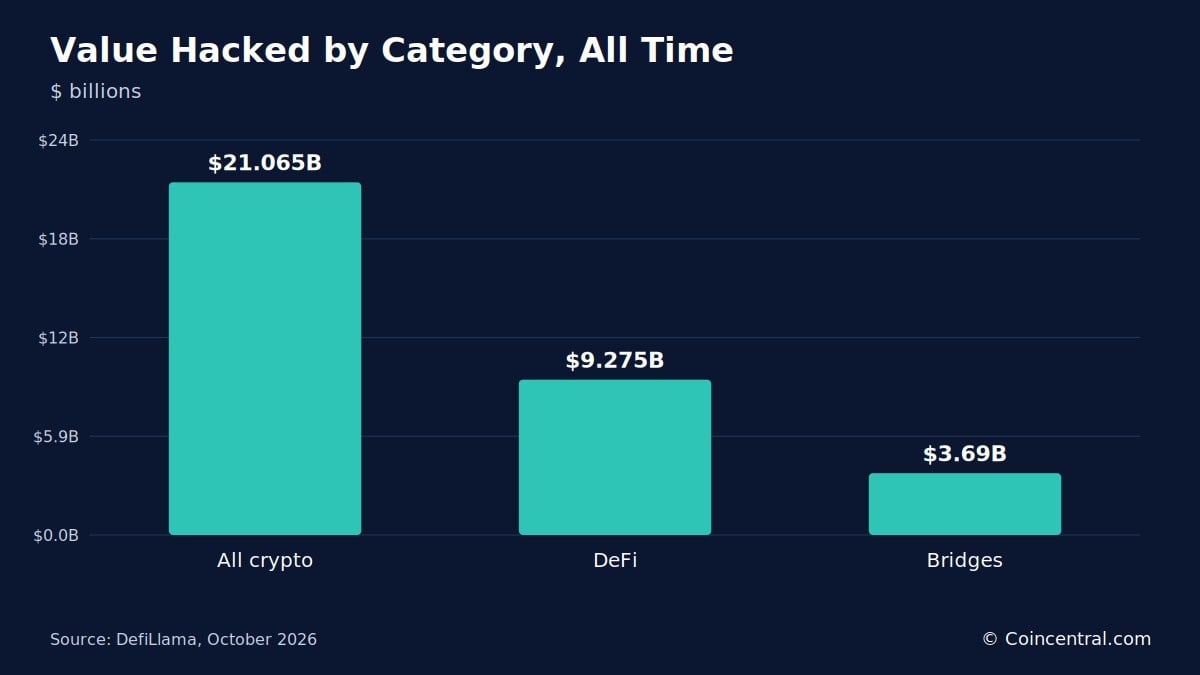 Figure 11: Total value hacked across all crypto, DeFi and bridges. Source: DefiLlama, October 2026.
DEX Market Size, Outlook and Recent Developments
The Business Research Company puts the decentralized exchange market at $44.22 billion in 2025 and $53.97 billion in 2026, a growth rate of 22%. It forecasts $120.65 billion by 2030, a rate of 22.3%. This is a revenue-based estimate, so it is a different measure from trading volume.
The firm lists regulatory clarity, institutional DeFi use and cross-chain trading as growth drivers. It also cites demand for self-custody. The National Cryptocurrency Association says 55 million US adults use crypto, and 76% of them say it has had a positive effect on their lives.
Centralized platforms are also moving into DEX trading. In August 2025, Coinbase gave US users access to DEX liquidity inside its app. SushiSwap bought Vortex Protocol in February 2023 to add on-chain perps.
| October 2, 2026 | SMBC Nikko and Nethermind said they are building the DeFi Gateway on Uniswap v4 for Japanese investors, due mid-2027 |
| September 24, 2026 | Bitget lost $387 million in a hot wallet key compromise |
| September 23, 2026 | PancakeSwap began paying liquidity providers 90% of fees in Infinity pools on Robinhood Chain |
| September 16, 2026 | Uniswap went live on Arc, Circle’s Layer 1, and reported $2.7 trillion in stablecoin volume since 2020 |
| September 14, 2026 | Andreessen Horowitz and the DeFi Education Fund asked the SEC for a safe harbor from exchange registration for DEXs |
Sources: CoinLaw, October 2026
The SEC request matters for US users. Its outcome will shape how they reach DEXs and the apps that connect to them.
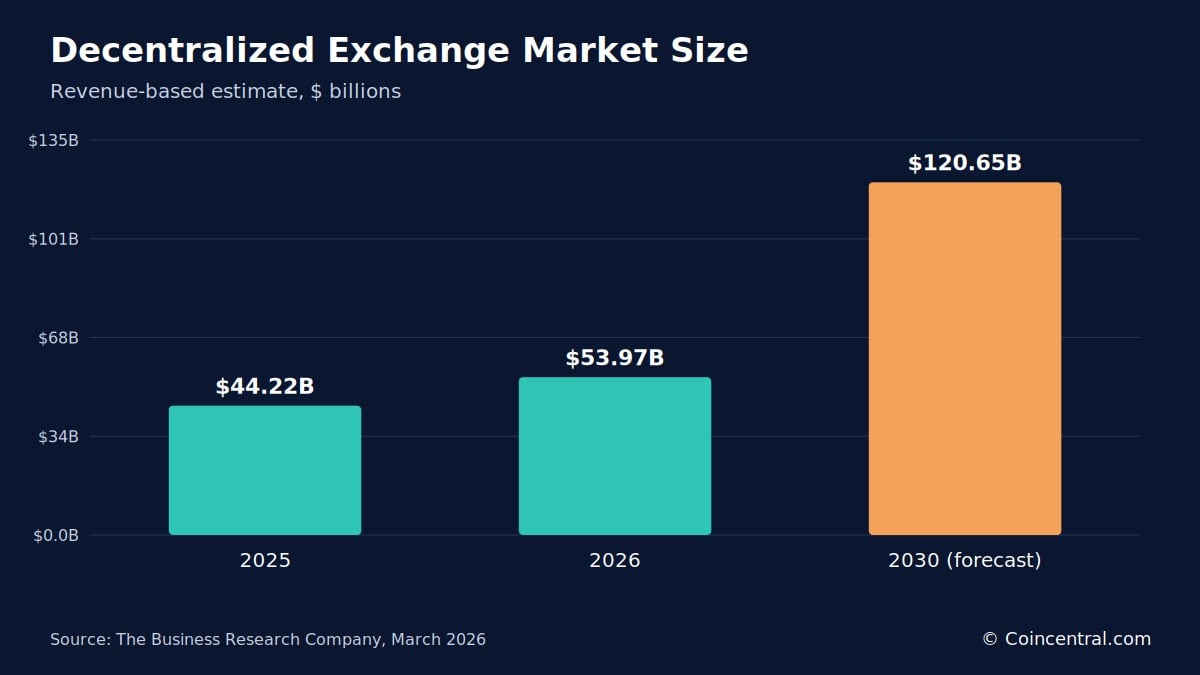 Figure 12: Market size estimate and 2030 forecast. Source: The Business Research Company, March 2026.
Conclusion
DEXs moved $273.795 billion in spot volume over 30 days, and perp DEXs moved $614.25 billion. On-chain trading now leans toward leveraged perps, while Uniswap holds the largest share of spot volume.
DEX share of spot trading has doubled in two years, yet CEXs still handle most of the volume. Because DEX figures move quickly, readers should compare numbers from the same window and check the source date.
This article is for information only and is not financial advice.
Sources
- CoinLaw: DEX Statistics 2026, Volume, Market Share and Perp DEX Data
- CoinGecko: CEX and DEX Trading Activity Report 2026
- DefiLlama: DEX Volume Rankings
- DefiLlama: Perp Volume Rankings
- DefiLlama: DEX Aggregator Volume Rankings
- DefiLlama: Fees Rankings
- DefiLlama: Hacks Overview
- Research and Markets: Decentralized Exchange Market Report 2026
- CryptoSlate: Decentralized Crypto Exchanges in 2026
- Changelly: The Best Decentralized Exchanges (DEXs) in 2026
- Quantumrun: Decentralized Finance Market Statistics 2026
The post DEX Statistics 2026: Volume, Market Share and Perp Data appeared first on Blockonomi.
What's Your Reaction?
 Like
0
Like
0
 Dislike
0
Dislike
0
 Love
0
Love
0
 Funny
0
Funny
0
 Wow
0
Wow
0
 Sad
0
Sad
0
 Angry
0
Angry
0










Comments (0)