

Upcoming MSI Afterburner update adds heatmap to V/F curve editor to show your GPU's boosting behavior — new feature shoots for better overclocks with more data
 (Image credit: MSI)
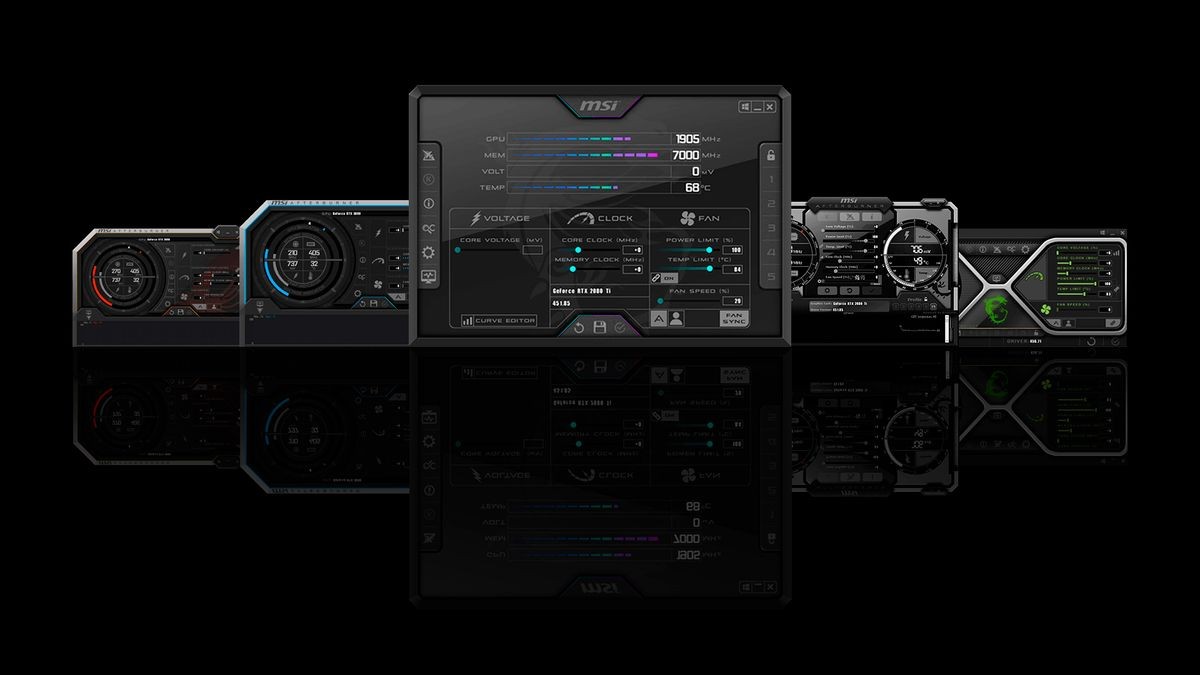
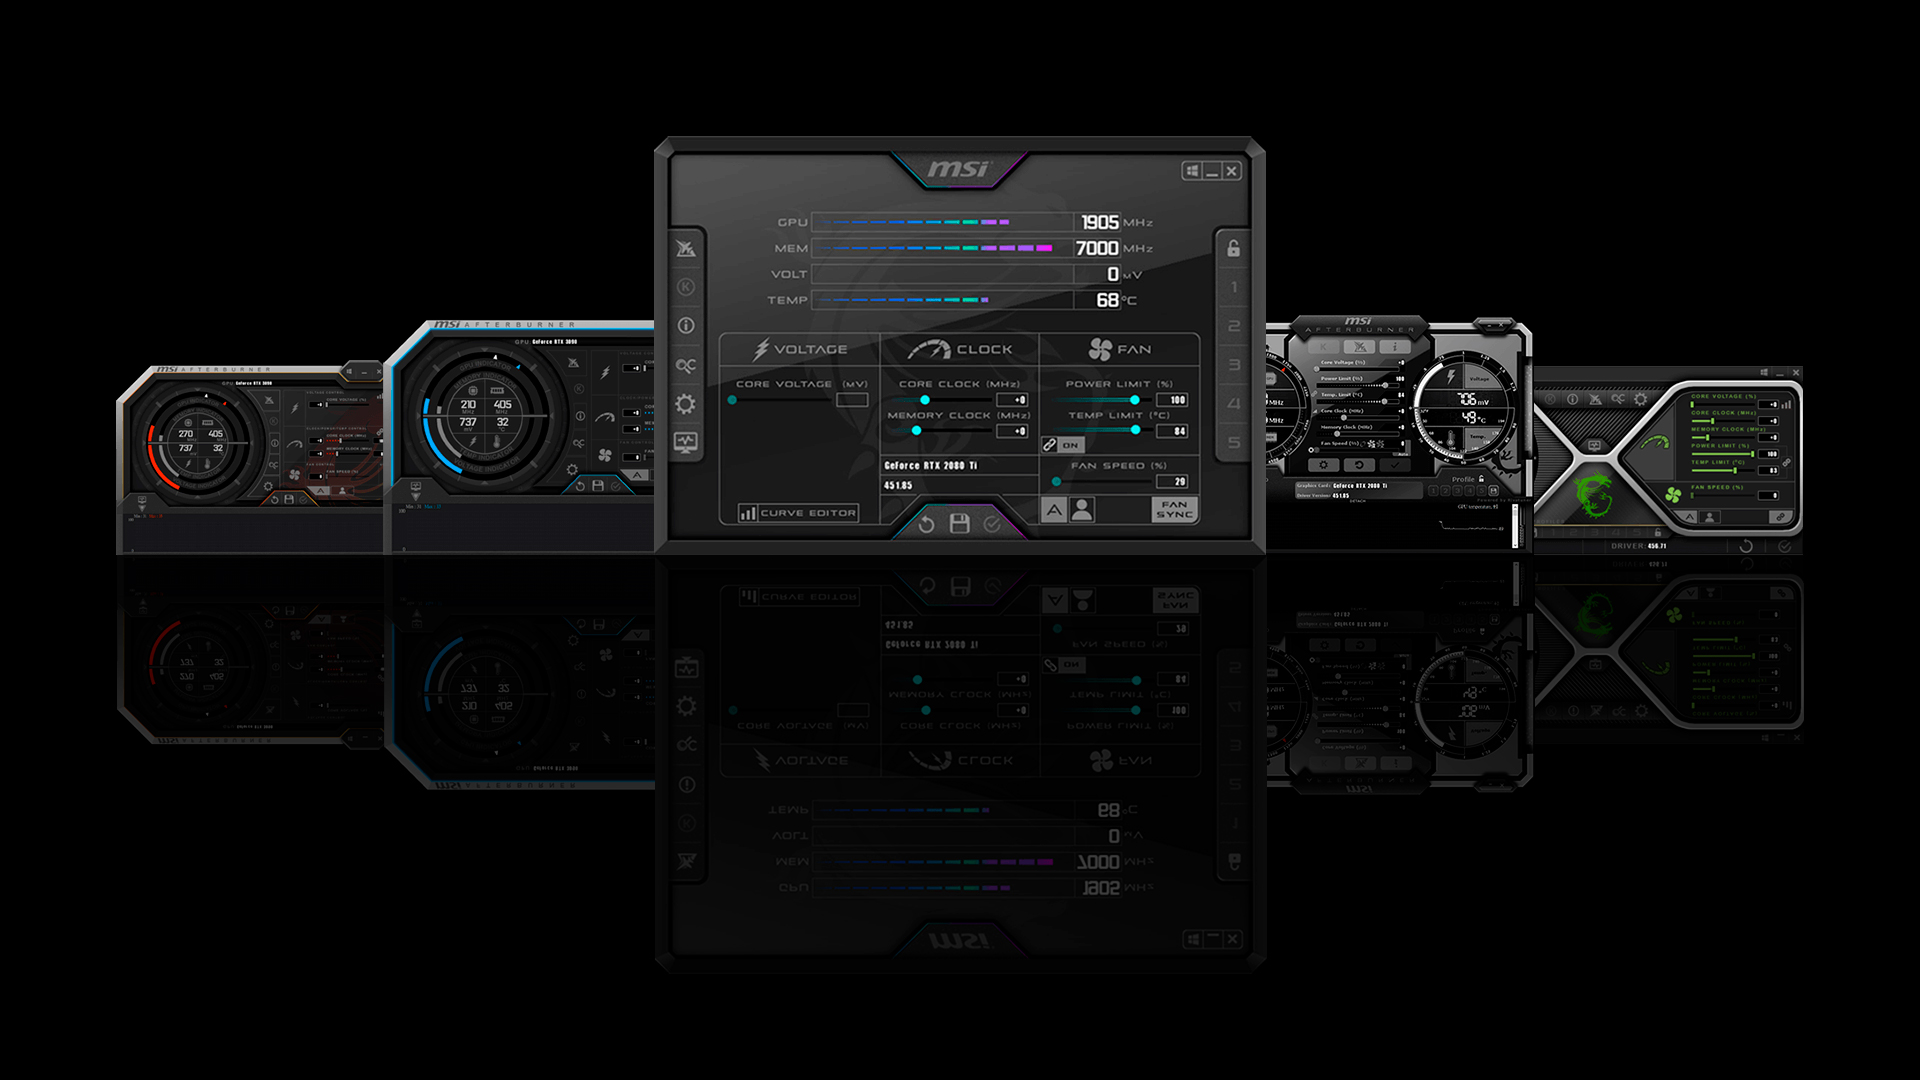
MSI Afterburner’s solo developer is working on a new update that provides a heatmap of the most-used voltage/frequency points a GPU is operating at within Afterburner’s voltage/frequency curve chart. The update is designed to help enthusiasts and overclockers better understand the boosting behavior of their GPU and adjust their GPU’s overclock accordingly. Unwinder, Afterburner’s developer, reported on the Guru3D forums that this update will be released with 4.6.7 beta4 for users to test. An official (non-beta) release with the heatmap has not been announced yet.
The new heatmap generates yellow dots within Afterburner’s existing V/F curve editor, making it easy to compare the GPU’s existing V/F curve against where the GPU is boosting in real workloads. For instance, Unwinder shared a screenshot of the heatmap being used with an RTX 5090, showing the GPU operating primarily at 800mv at 1200MHz, and 1000- 1055 mV at around 2.6 to 2.8GHz. The former relates to the GPU’s behavior at idle/low-load workloads and the latter at maximum load.
the next beta of msi afterburner developed by unwinder adds V/F hit map.v4.6.7 beta4 (not yet released)https://t.co/sJxErlqMLVthe current latest beta is v4.6.7 beta3 build17352 (jun 19)https://t.co/o4jRfXFMJP https://t.co/cEMaQHaDTe pic.twitter.com/7vKK0rgyhhJuly 12, 2026
Unwinder revealed that one interesting perk of the new heatmap system is its ability to identify the differences in boosting behavior between Nvidia’s RTX 40-series and older GPUs, and RTX 50-series GPUs. Improvements in Blackwell’s DVFS, or Dynamic Voltage Frequency Scaling, make the GPU behave very differently compared to RTX 40-series GPUs or older. Unwinder shared an additional screenshot of an RTX 4090 running the heatmap, showing yellow dots only around the lower and upper ranges of the V/F curve. By contrast, the heatmap of the RTX 5090 shows yellow dots across the entire V/F curve, revealing that the RTX 5090 is spending more time in the middle range of the curve than its predecessor.
MSI Afterburner’s new heatmap aims to help overclockers more accurately adjust their overclocks according to what voltage/frequency points the GPU is prioritizing in real workloads. For the uninitiated, V/F curve overclocking manipulates the GPU’s boosting algorithm by changing the shape of its V/F curve. If you're able to sustain the same clock speed at a lower voltage, that should mean a higher voltage can push a higher clock speed, which is the idea behind undervolting with a V/F curve before overclocking with an offset.

Follow Tom's Hardware on Google News, or add us as a preferred source, to get our latest news, analysis, & reviews in your feeds.
Get Tom's Hardware's best news and in-depth reviews, straight to your inbox.
Aaron Klotz is a contributing writer for Tom’s Hardware, covering news related to computer hardware such as CPUs, and graphics cards.
What's Your Reaction?
 Like
0
Like
0
 Dislike
0
Dislike
0
 Love
0
Love
0
 Funny
0
Funny
0
 Wow
0
Wow
0
 Sad
0
Sad
0
 Angry
0
Angry
0





Comments (0)