


Bitcoin Price Analysis: Is BTC Poised to Retest the $100K Support?
Bitcoin is undergoing a retracement after hunting the liquidity above the $111K level, and is now approaching a key support zone around the $100K recent swing low. A breakdown below this level could trigger a deeper correction in the coming sessions. Technical Analysis By ShayanMarkets The Daily Chart Bitcoin has entered a corrective phase after […]
Bitcoin is undergoing a retracement after hunting the liquidity above the $111K level, and is now approaching a key support zone around the $100K recent swing low. A breakdown below this level could trigger a deeper correction in the coming sessions.
Technical Analysis
By ShayanMarkets
The Daily Chart
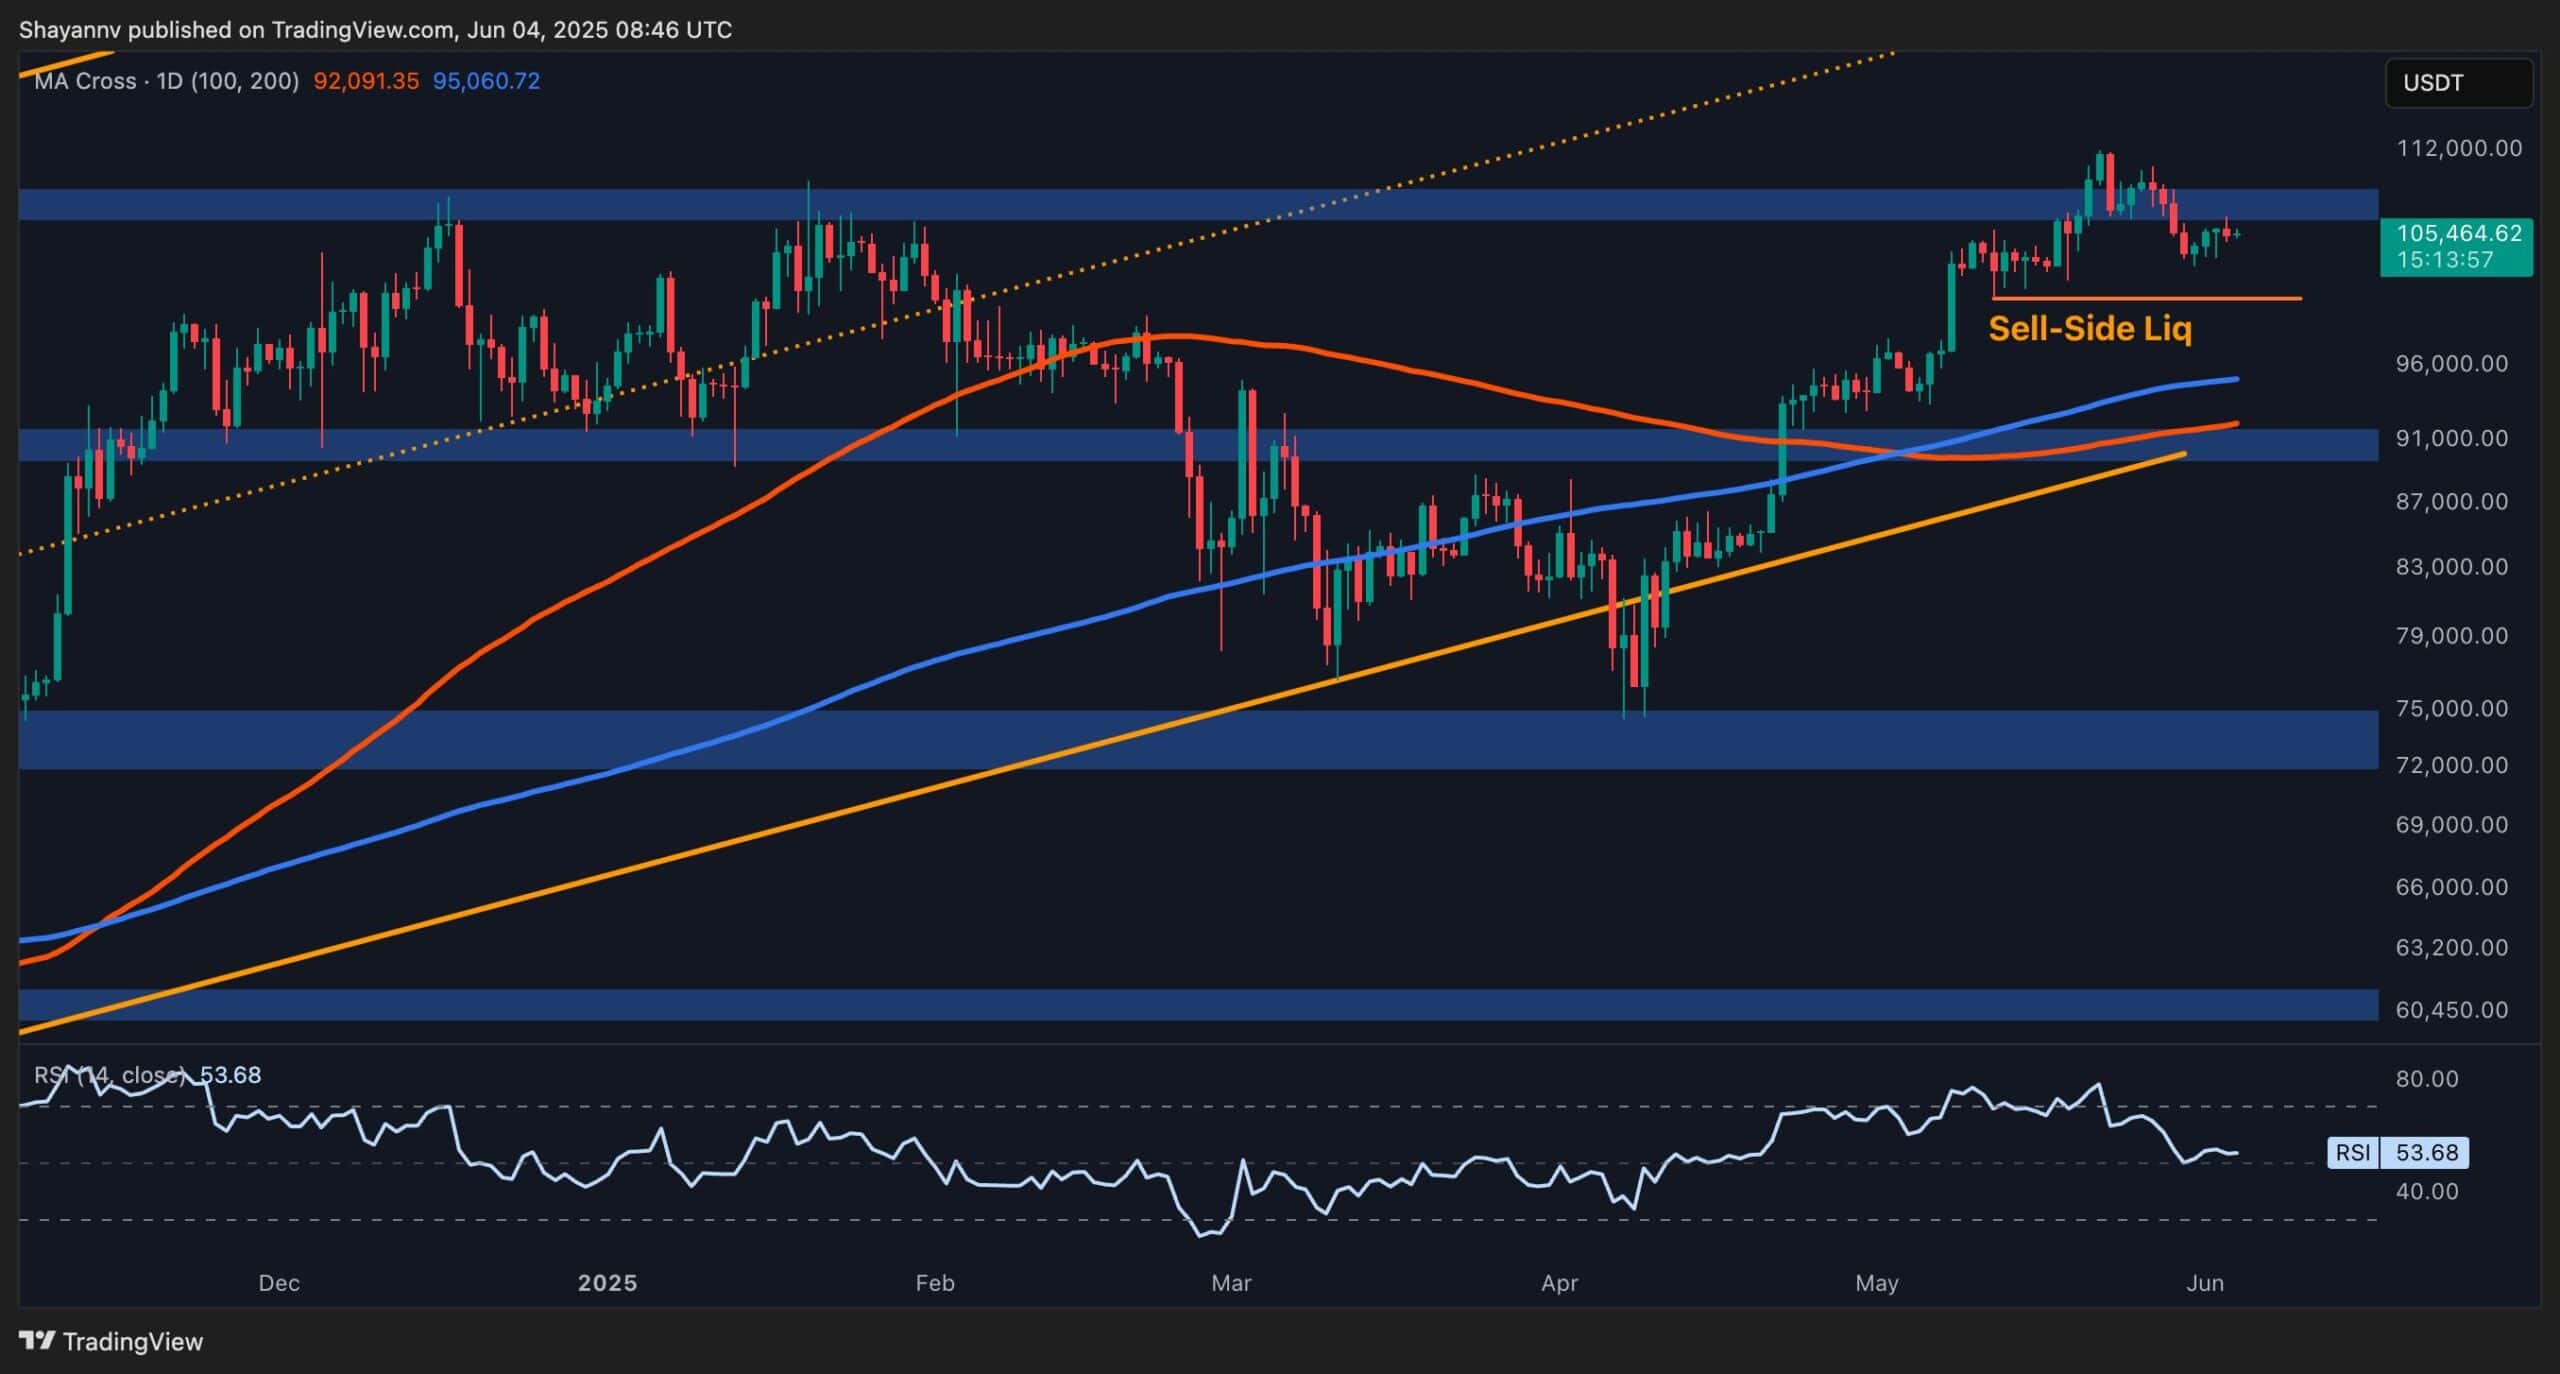
Bitcoin has entered a corrective phase after tapping liquidity above the $111K level, encountering significant selling interest in that region. This distribution-driven pullback has pushed the price down toward a pivotal support zone near the recent swing low at $100K, a key area that could determine the asset’s next directional move.
Market momentum has noticeably cooled, and the RSI is hovering near the neutral 50 level, further reflecting indecision among participants. Should this support hold and fresh demand re-enter the market, a recovery toward the $111K all-time high becomes increasingly probable.
Conversely, if sellers manage to push the price below this crucial $100K support, a continuation of the downtrend is likely, with the 200-day moving average around $95K emerging as the next potential target.
The 4-Hour Chart
Zooming in, Bitcoin has broken down from a long-standing ascending channel and confirmed the move with a textbook pullback to the channel’s lower boundary near $106K, a bearish order block. This rejection led to renewed selling pressure, driving the price toward $103K.
Currently, BTC is consolidating within a bearish flag pattern, a classic continuation setup that typically precedes further downside. A breakdown below the $103K support would validate the pattern and likely extend the correction toward the $100K psychological level. However, if $103K acts as support, a period of sideways movement within the $103K–$106K range could unfold, awaiting a decisive breakout to define the next market direction.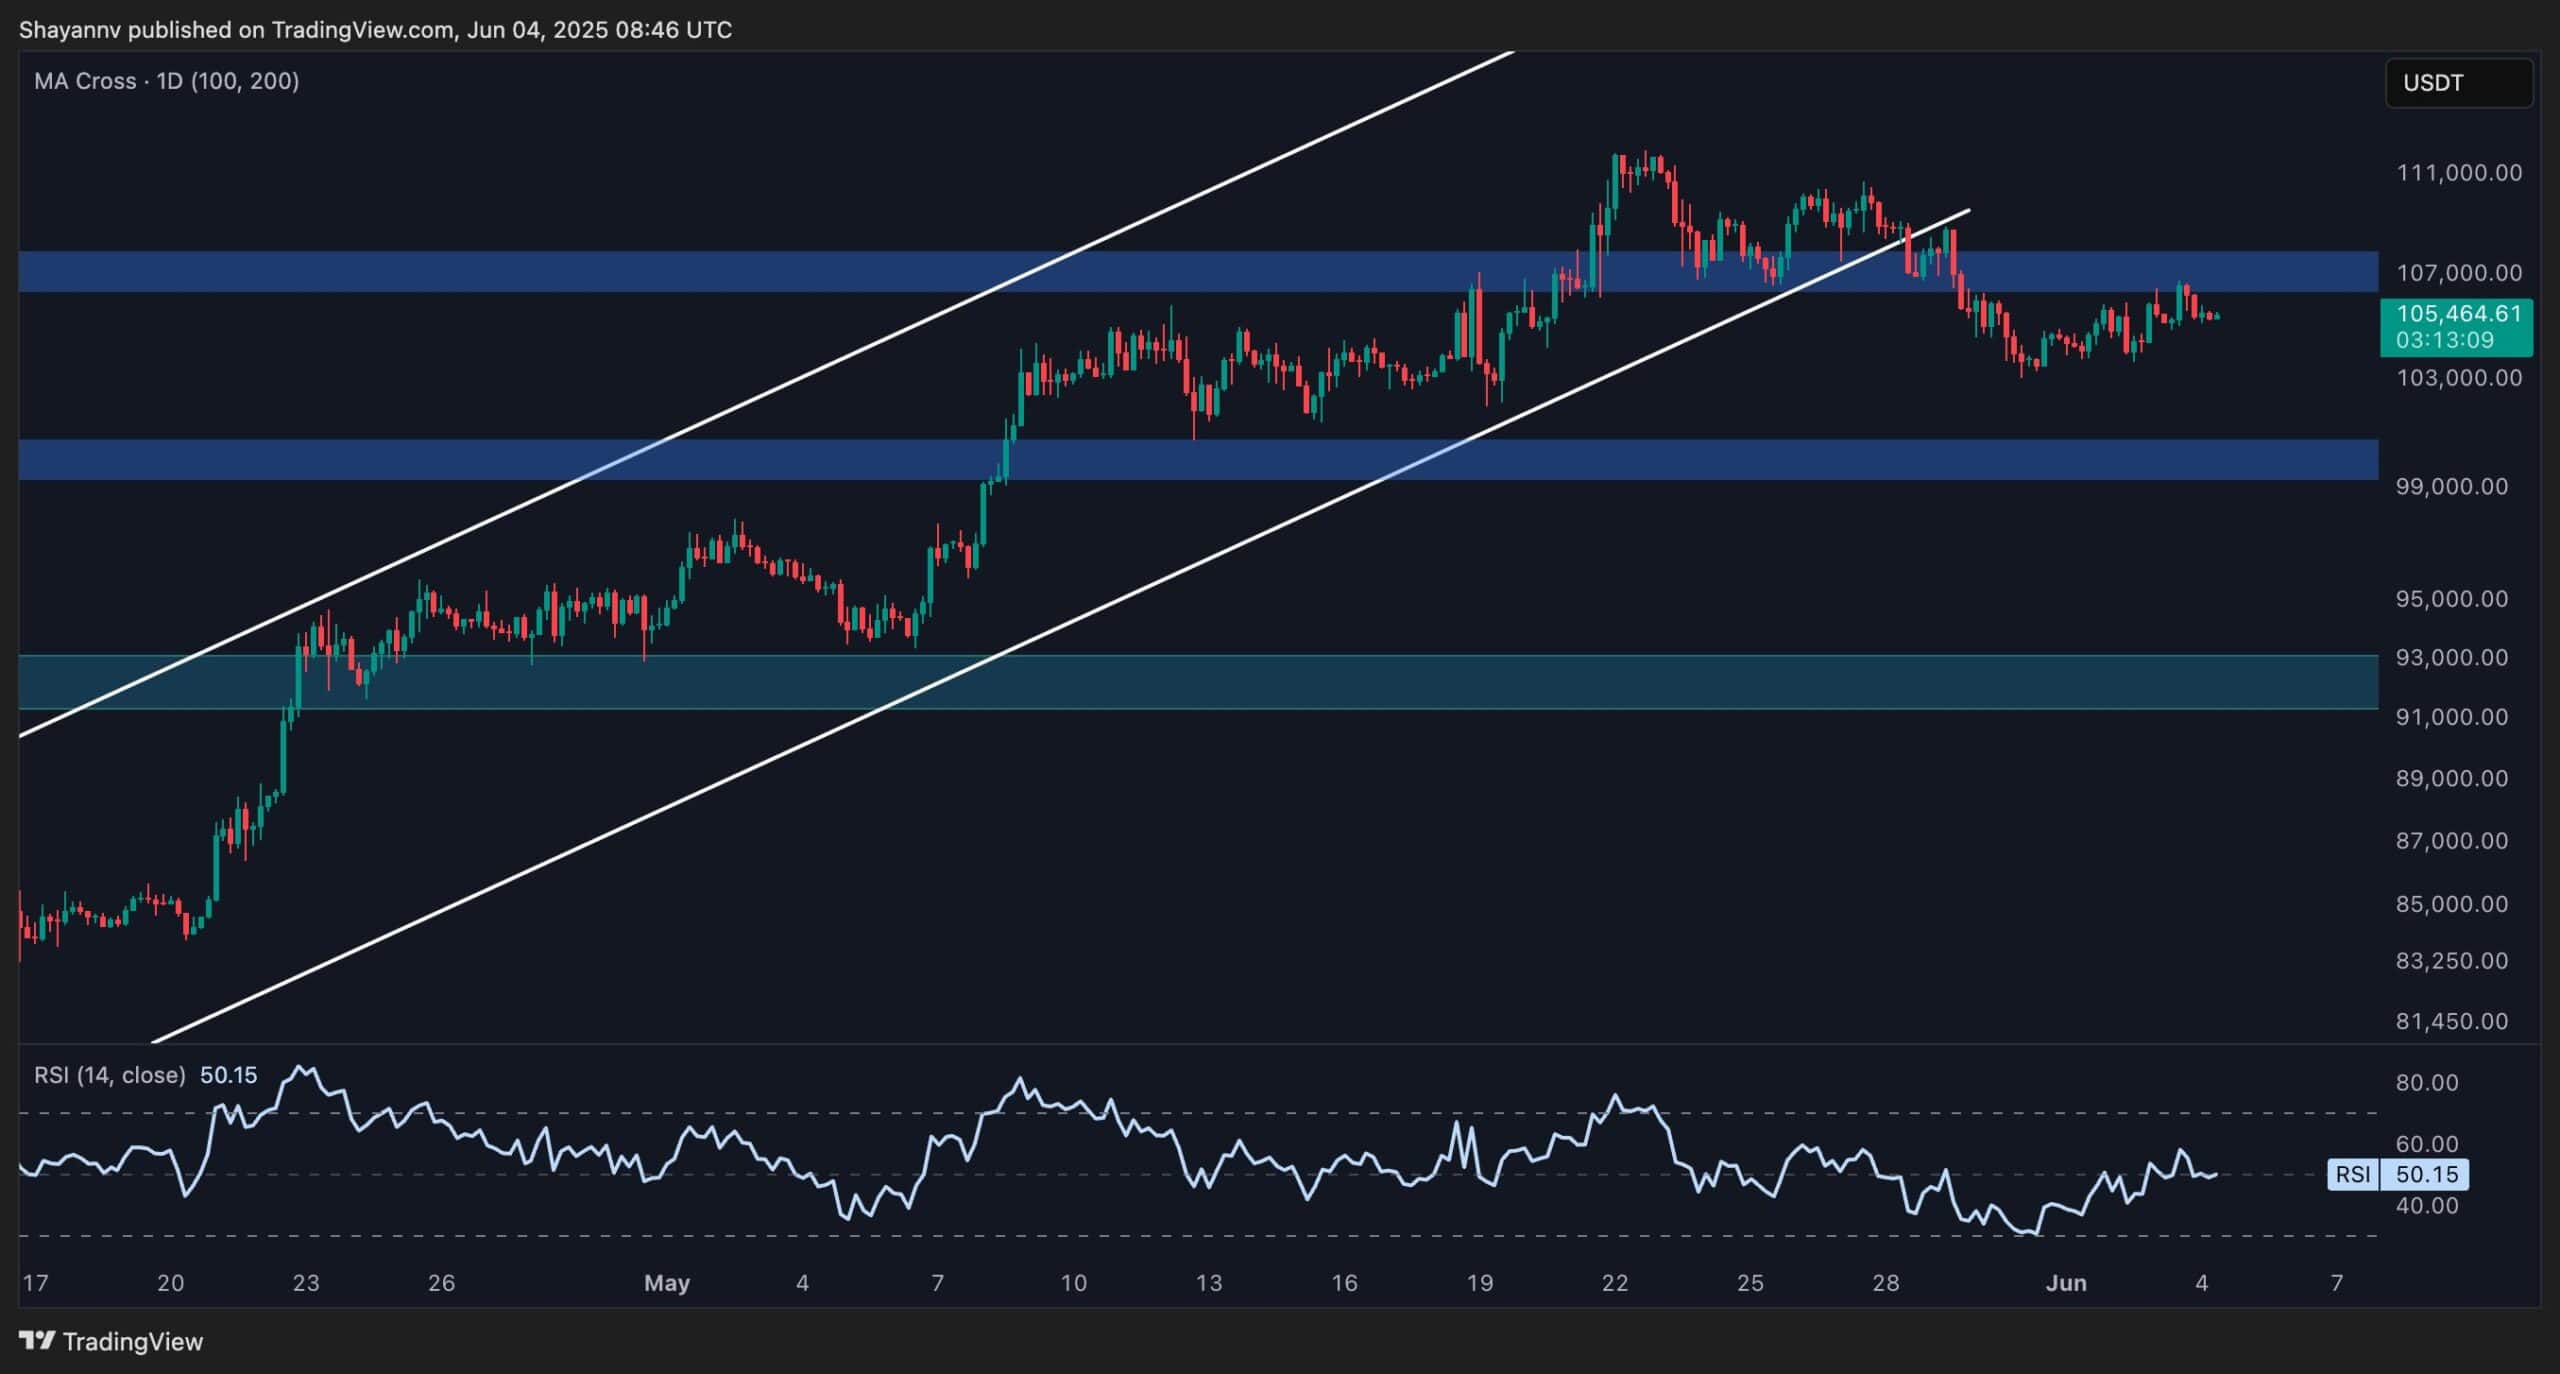
On-chain Analysis
By ShayanMarkets
This chart illustrates the Exchange Outflow metric, which tracks the number of coins withdrawn per transaction from centralized exchanges. Elevated outflow values typically suggest that investors are transferring larger amounts of Bitcoin off exchanges, often interpreted as a signal of reduced short-term selling pressure and a preference for holding.
A major development recently occurred on Bitfinex, where nearly 20,000 BTC, valued at over $1.3 billion at current market prices, was withdrawn in a single day. This marks the largest daily outflow from Bitfinex since July 2022, a notable event that often signals strategic accumulation by large investors or institutions. Such significant withdrawals are generally associated with long-term storage intentions, reducing the likelihood of these coins re-entering the market in the near term.
Despite the current market volatility and price consolidation, several on-chain and derivative market indicators point toward a potential bullish phase. The alignment of neutral funding rates, deleveraging through liquidations, and heightened whale accumulation suggests the market may be undergoing a healthy reset, potentially paving the way for Bitcoin’s next upward leg.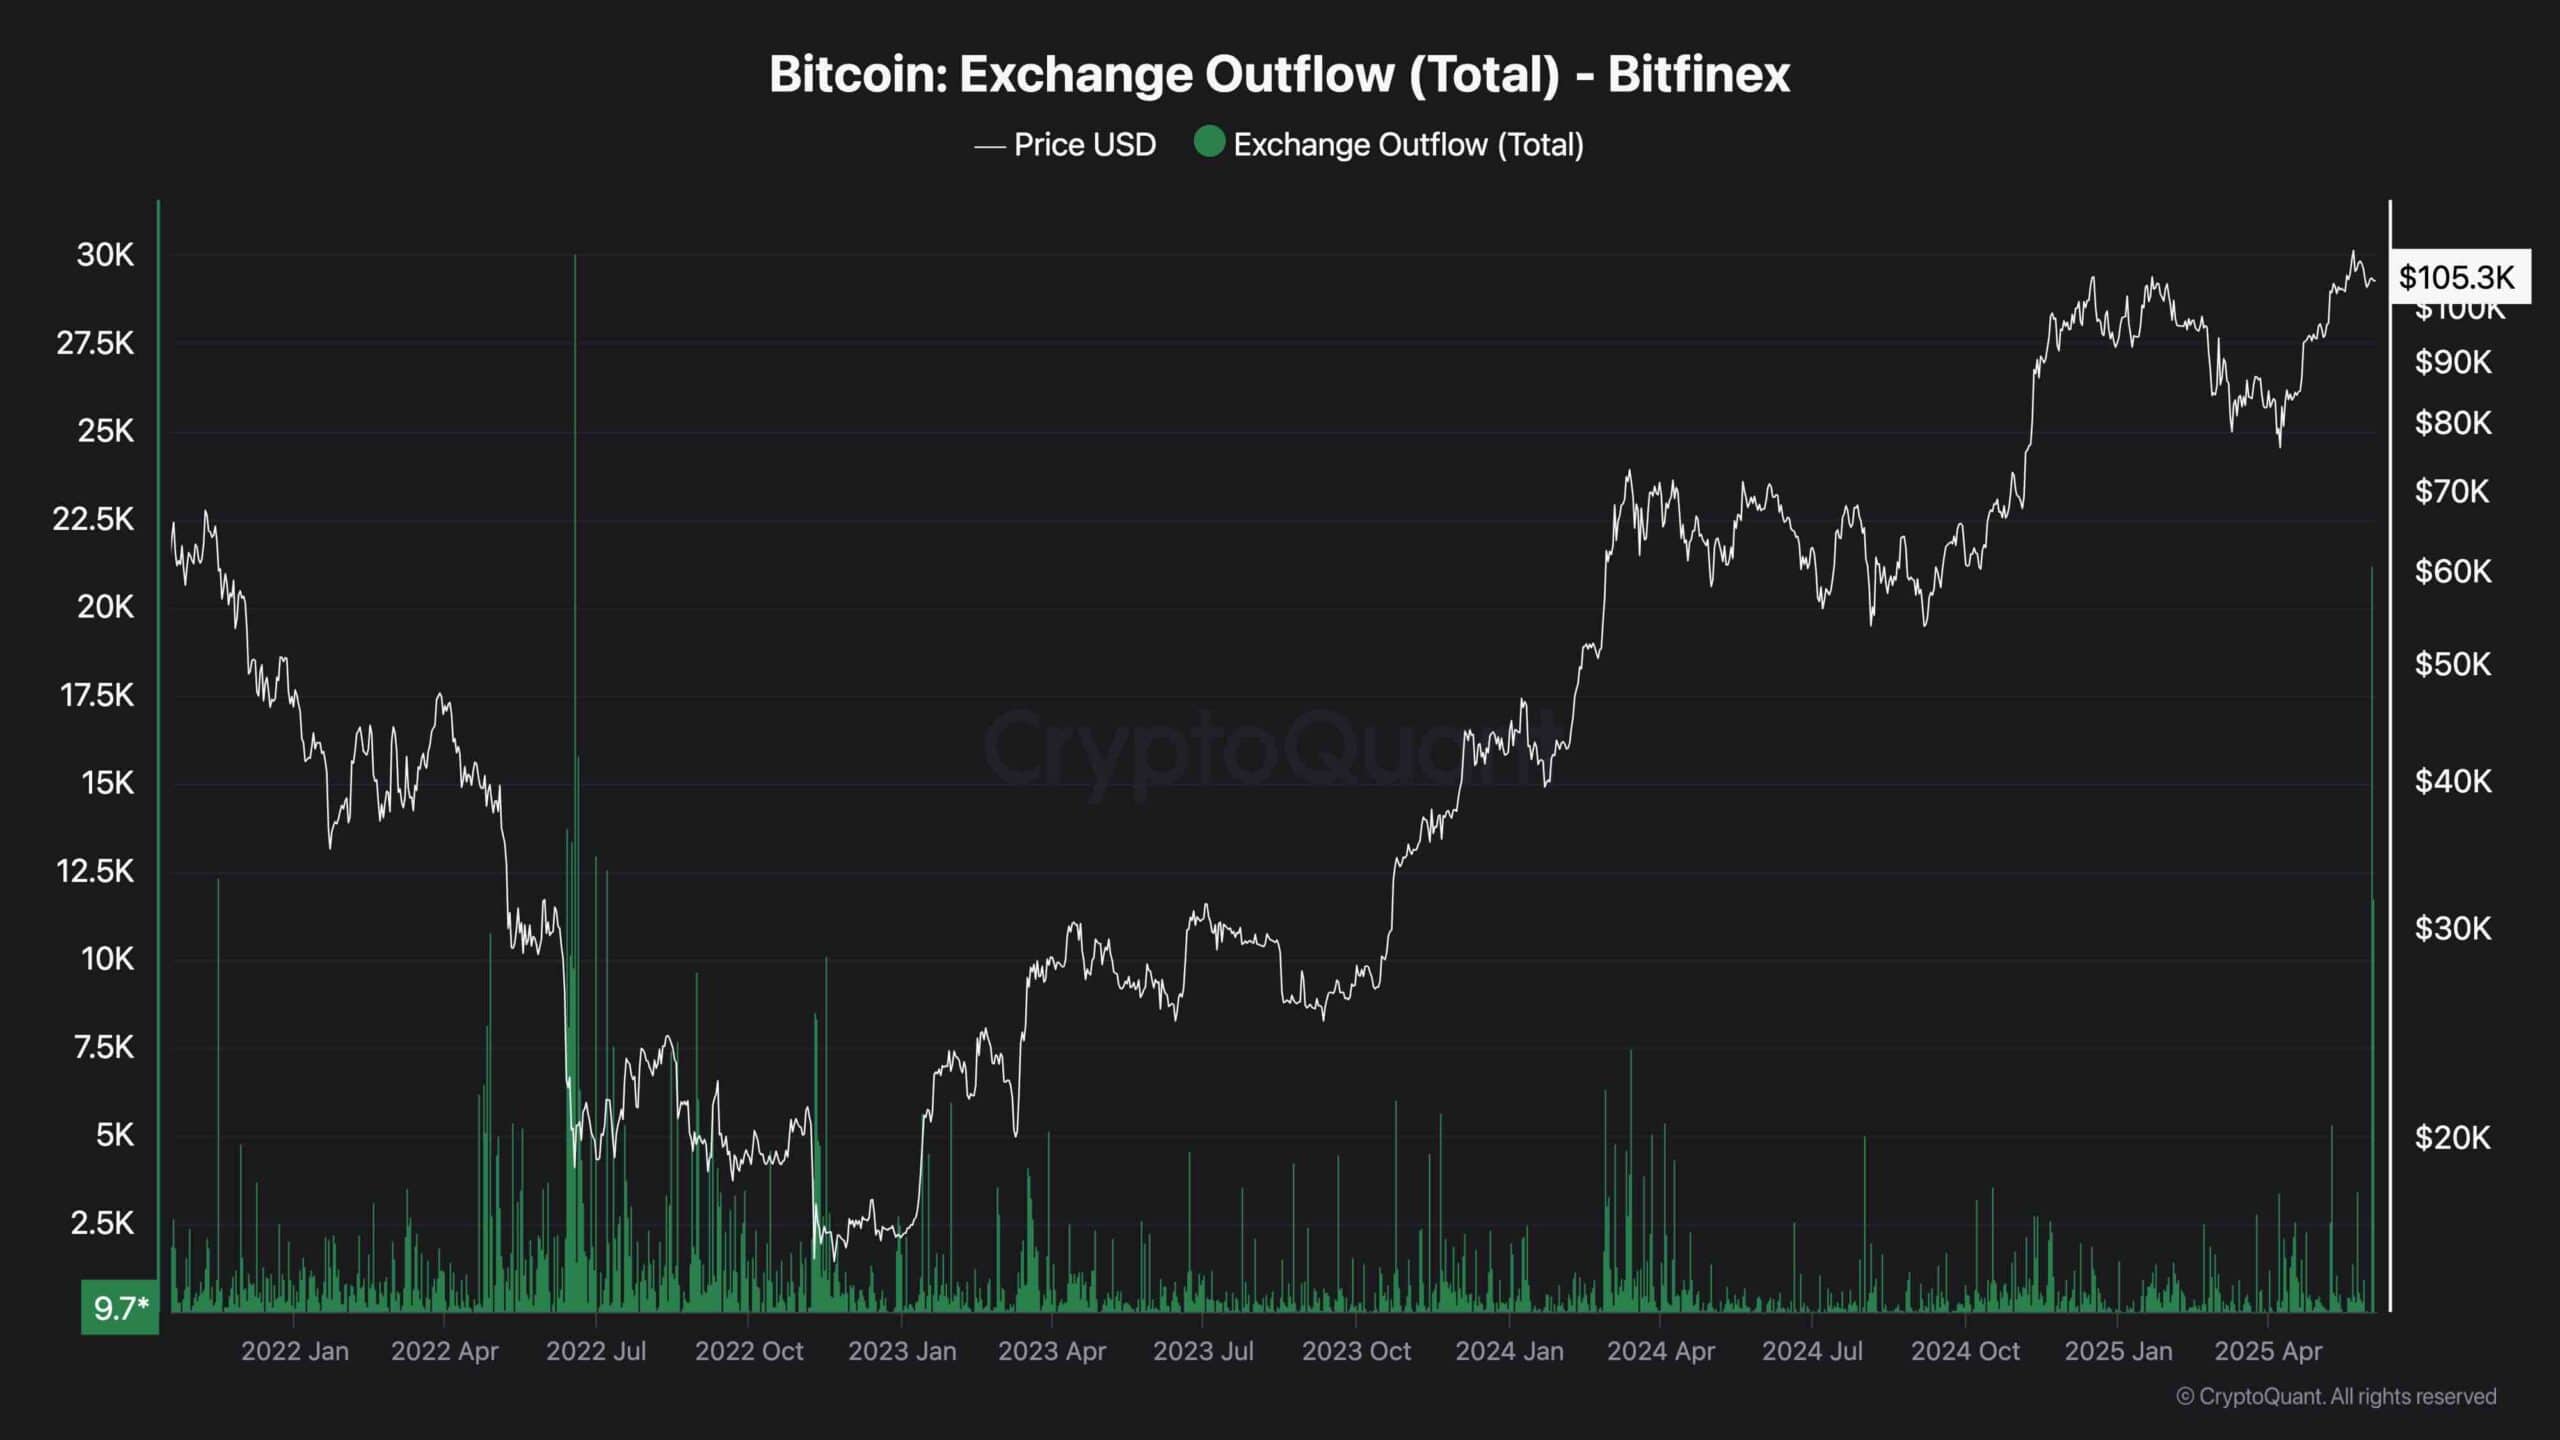
The post Bitcoin Price Analysis: Is BTC Poised to Retest the $100K Support? appeared first on CryptoPotato.