

Bitcoin Risks $72,500 Slide as $82,000 Resistance Caps Recovery
TLDR:
- Ali Charts flags $72,500 as a potential Bitcoin buying zone while $82,000 remains resistance on his chart.
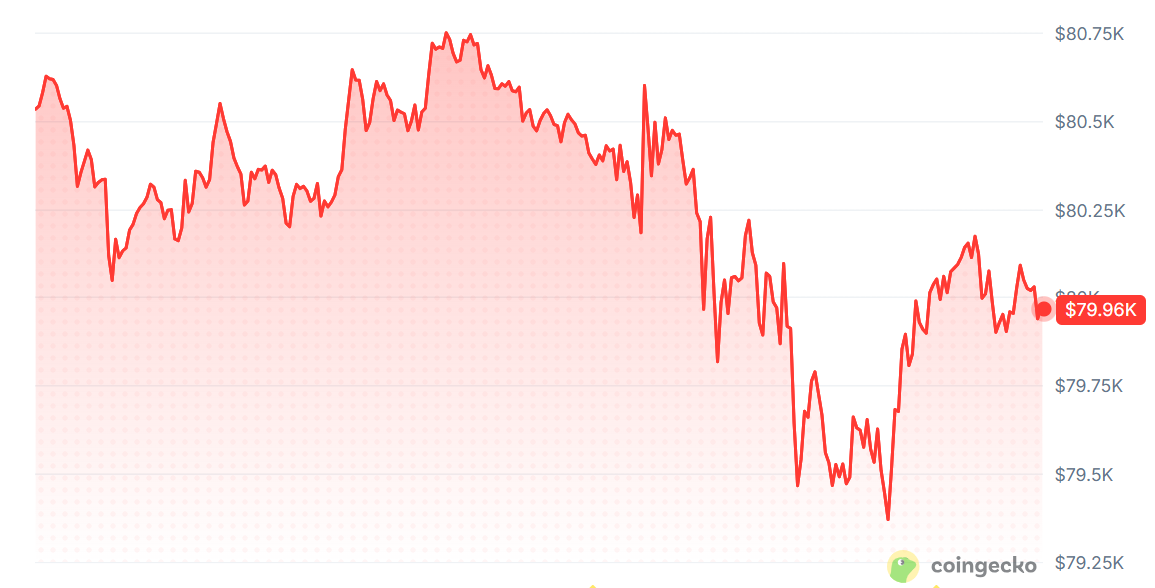
- Bitcoin trades at $79,757.25, down 0.74% daily and 3.22% weekly, according to supplied CoinGecko price data.
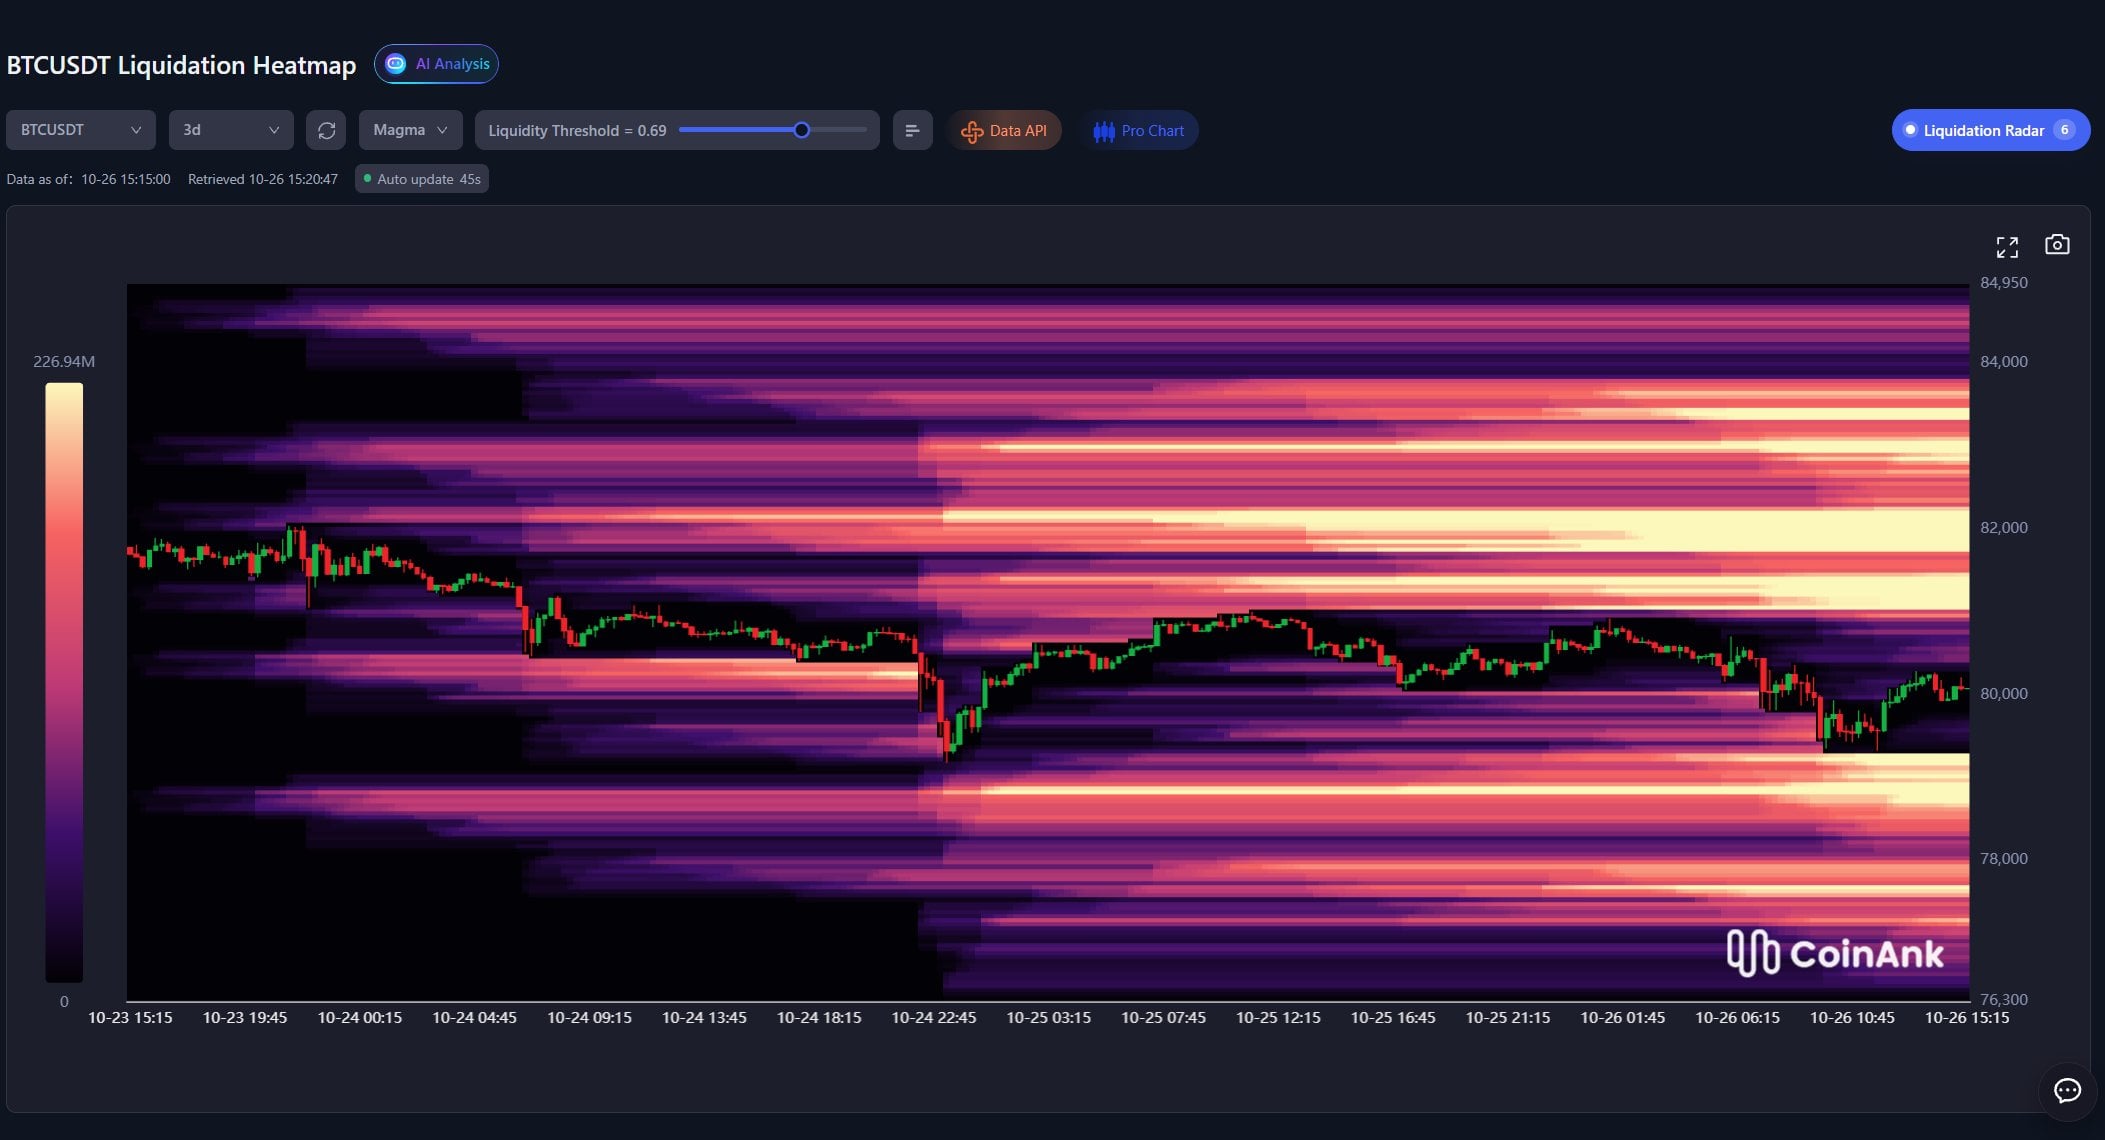
- Liquidation heatmaps show overhead clusters near 81,500–82,000 and downside pockets at 78,500–79,000.
- A recovery above $81,000 could pressure shorts, while losing $79,000 would bring lower liquidity into focus.
Bitcoin traded at $79,757.25 as analyst Ali Charts identified $72,500 as a potential buying zone following a chart breakdown.
CoinGecko data showed Bitcoin fell 0.74% over 24 hours and 3.22% across seven days. Its 24-hour trading volume reached $18,307,119,776, while liquidation heatmaps showed concentrated exposure above and below the market.
Ali Charts said Bitcoin could continue correcting while $82,000 holds as resistance on the four-hour chart. However, That Martini Guy flagged potential short liquidations above $81,000, leaving room for an upside squeeze.
BTC price on CoinGeckoBitcoin Price Breakdown Puts $72,500 in Focus
In his X post, Ali Charts identified an apparent breakdown below a rising parallel channel. This pattern tracks price between two upward-sloping boundaries, outlining the market’s previous direction.
A break below the lower boundary suggests that the earlier upward structure has weakened. It does not establish how far Bitcoin will fall or guarantee that selling will continue.
For Ali Charts, $82,000 now defines the condition behind his bearish outlook. While Bitcoin stays below that level, he sees scope for a correction toward $72,500.
That target sits approximately 9.1% below CoinGecko’s quoted price of $79,757.25. The analyst described it as an area where he would seek his next buying opportunity.
His proposed entry, therefore, depends on further weakness, rather than a confirmed reversal at current prices. Traders should also distinguish an analyst’s preferred buying level from evidence that buyers have already stepped in.
Bitcoin Liquidation Clusters Leave Both Directions Open
Meanwhile, That Martini Guy’s one-week heatmap showed a large liquidity cluster just above $81,000. He said a move toward $82,000 could accelerate if rising prices trigger short liquidations.
Short liquidations occur when leveraged bearish positions lose enough collateral that exchanges forcibly close them. Those closures can require buying, adding upward pressure as Bitcoin advances through concentrated positions.
However, the same heatmap also showed liquidity below $80,000, including another pocket around 78,000–79,000. That Martini Guy identified $81,000 as the level bulls need to reclaim.
He warned that losing the $79,000 area would make downside liquidity a greater concern. He also cautioned that nearby liquidity does not necessarily attract price first or guarantee a reversal.
CoinAnk’s three-day BTCUSDT heatmap showed a similar arrangement after Bitcoin declined from around $82,000. Its dense overhead band stretched across $81,500-$82,000, while a lower concentration occupied $78,500-$79,000.
CoinAnk said the recent decline had cleared liquidation concentrations from the middle of that range. This leaves traders watching the remaining clusters for evidence of renewed pressure in either direction.
 Source: CoinAnk
Bitcoin’s immediate test centers on reclaiming $81,000 and challenging $82,000 while defending the $79,000 area. The $72,500 buying zone remains Ali Charts’ downside scenario, rather than an established destination.
The post Bitcoin Risks $72,500 Slide as $82,000 Resistance Caps Recovery appeared first on Blockonomi.
What's Your Reaction?
 Like
0
 Dislike
0
 Love
0
 Funny
0
 Wow
0
 Sad
0
 Angry
0










Comments (0)