

Options Trading Statistics 2026: Volume, Retail Traders and 0DTE Data
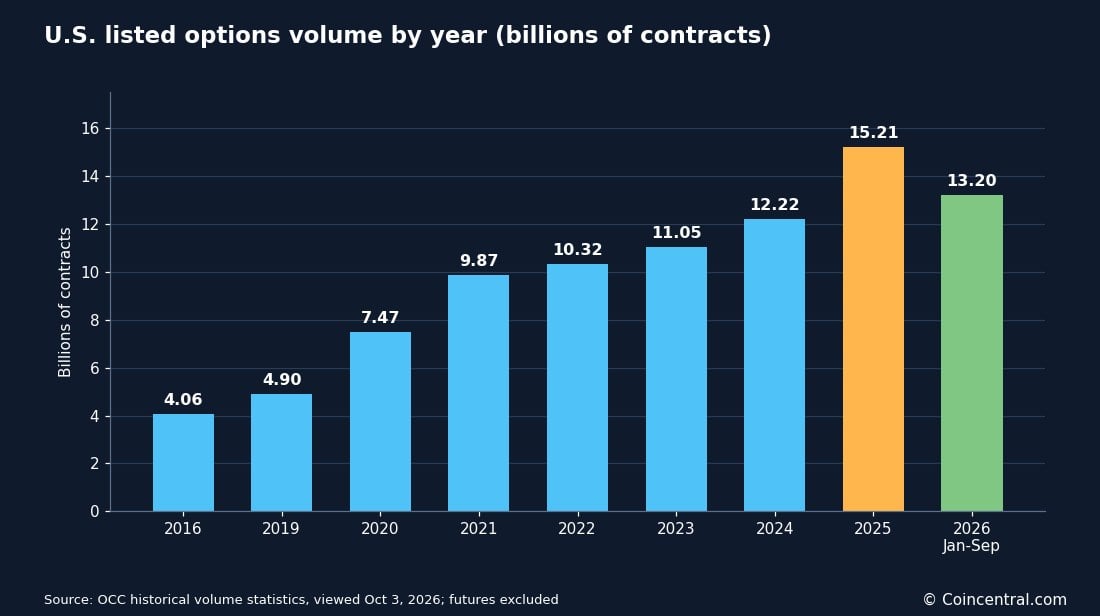
U.S.-listed options volume reached a record 15.21 billion contracts in 2025, up 24.4% from 2024, according to the Options Clearing Corporation (OCC). It was the sixth record year in a row.
The pace rose again in 2026. Through September, an average of 70.6 million contracts traded each day, up 20.6% from the same months of 2025.
This article gathers the latest numbers on market size, products, traders, retail share, same-day expiration options and trading costs. Each figure is tied to its source and period. Where sources disagree, we say so.
Options Trading Statistics at a Glance
| Individual customers who traded U.S. options | About 5.3 million | SEC staff, Apr 2026 | Nov 2022 to end of 2025 |
| U.S. investors who have ever traded options | 21% | FINRA Foundation, Dec 2025 | 2024 survey |
| U.S. listed options volume | 15.21 billion contracts | OCC, Jan 2026 | 2025 |
| Average daily volume | 70.6 million contracts | OCC, Oct 2026 | Jan to Sep 2026 |
| 0DTE share of SPX options volume | 66.2% | Cboe, Aug 2026 | July 2026 |
| Options that expire worthless | About 22% | Options Industry Council, undated | Historical |
| Aggregate retail options loss | About $2.1 billion (estimate) | Journal of Finance, Dec 2023 | Nov 2019 to Jun 2021 |
Options volume has grown about 3.7 times in nine years. It rose from 4.06 billion contracts in 2016 to 15.21 billion in 2025, based on OCC data.
Growth sped up in 2020, when commission-free apps and pandemic-era retail trading pulled in new participants. Volume has set a record in each year since then.
Figure 1: U.S. listed options volume by year, in billions of contracts. Futures are excluded.| 2016 | 4.06 billion |
| 2019 | 4.90 billion |
| 2020 | 7.47 billion |
| 2021 | 9.87 billion |
| 2022 | 10.32 billion |
| 2023 | 11.05 billion |
| 2024 | 12.22 billion |
| 2025 | 15.21 billion |
| 2026, January to September | 13.20 billion |
Some sites list 7.52 billion for 2020 because the OCC also reports futures. The figures above count options only. Cboe puts 2025 growth at about 26%, while the OCC reports 24.4%, so each number is credited to its own source.
Daily Volume and the 2026 Pace
About 61 million contracts traded on an average day in 2025, according to Cboe. The OCC reports 60.6 million. The single-day record is 110 million contracts, set on October 10, 2025.
That record topped the earlier mark of more than 100 million set on April 4, 2025, during a tariff-driven selloff, as reported by Walnut. The year had 21 days above 70 million contracts, and five of them were above 80 million.
In 2026, the average rose to 70.6 million contracts a day through September. That is 20.6% above the 58.5 million average of the same months in 2025, according to the OCC.
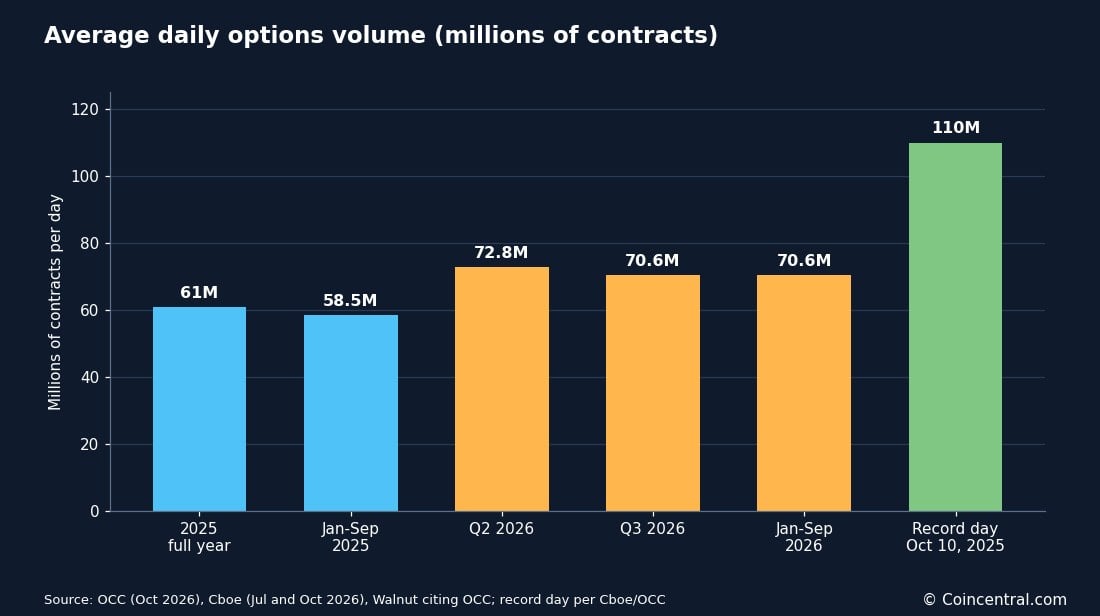 Figure 2: Average daily options volume in millions of contracts, with the single-day record for comparison.
| 2025, full year | About 61 million | Cboe |
| January to September 2025 | 58.5 million | OCC |
| Q2 2026 | 72.8 million, up more than 19% from a year earlier | Cboe |
| Q3 2026 | 70.6 million, down 4% from Q2 | Cboe |
| January to September 2026 | 70.6 million, up 20.6% | OCC |
| Record day, October 10, 2025 | 110 million | Cboe and OCC |
Cboe projected in July that 2026 is on pace for well above 18 billion contracts. Through September, the market had cleared 13.2 billion, about 87% of the 2025 record. Reaching 18 billion would need a faster fourth quarter than the first nine months.
Cboe also reported a one-day record of 33.4 million contracts across its own exchanges on June 5, 2026, when markets fell sharply, according to Reuters. Cboe’s second-quarter options net revenue rose 30% to $473.9 million as its average daily volume rose 26%.
Which Products Drive Options Volume
In 2025, single-stock options made up 54% of U.S. options volume, or 8.27 billion contracts. ETF options made up 37% (5.68 billion) and index options 8% (1.26 billion), based on OCC data.
| Single-stock options | 8.27 billion | 54% |
| ETF options | 5.68 billion | 37% |
| Index options | 1.26 billion | 8% |
Growth in 2026 has favored funds and indexes. Through September, average daily ETF options volume is up 35.4% and index options are up 29.3%. Equity options are up 9.3%, per OCC data reported by Walnut.
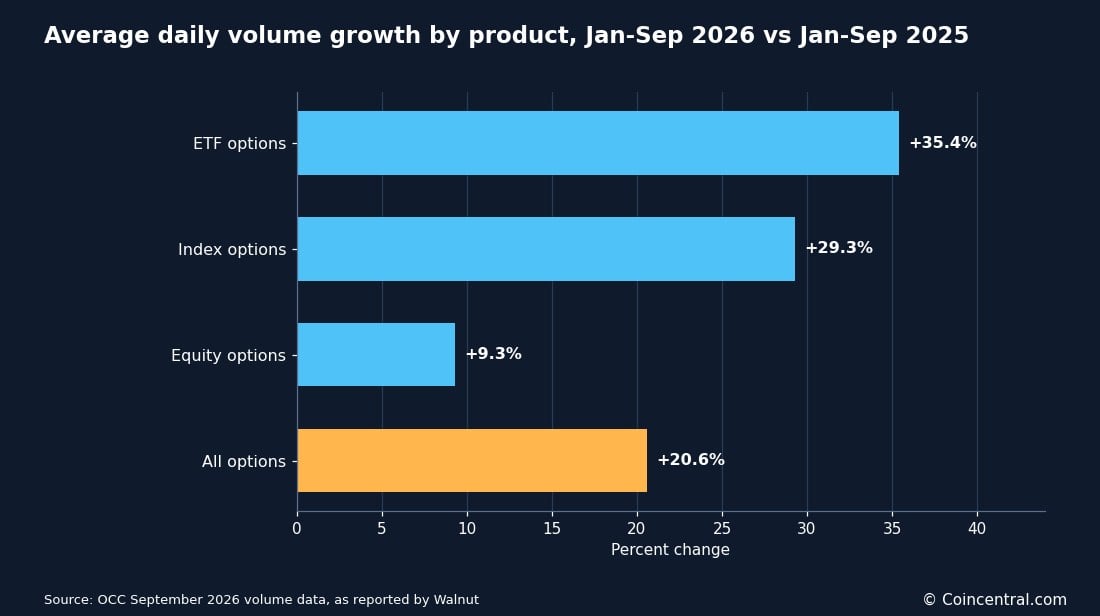 Figure 3: Average daily volume growth by product, January to September 2026 versus the same months of 2025.
Cboe’s first-half data shows the same pattern. Index options grew 25% and ETF options 27%, while single-stock options grew 6%. FLEX options, which are customized contracts, grew nearly 47%.
Volume is concentrated in a few names. In Q2 2026, SPX made up 81% of index options volume and SPY made up 42% of ETF options volume. Nvidia and Tesla each made up 9% of single-stock volume, followed by Apple at 3%.
SEC staff found that the 10 most-traded stocks made up 31.7% of single-stock options volume at the end of 2025. That is up from 24.0% in 2012.
How Many People Trade Options?
About 5.3 million individual customers traded U.S.-listed options from November 2022 to the end of 2025, according to SEC staff. The exact count is 5,299,576, which is 7.5% of the 70.6 million individual customers in the SEC’s data.
Far more of them traded stocks. A total of 70.2 million customers traded stocks, and only about 227,000 traded options without also trading stocks.
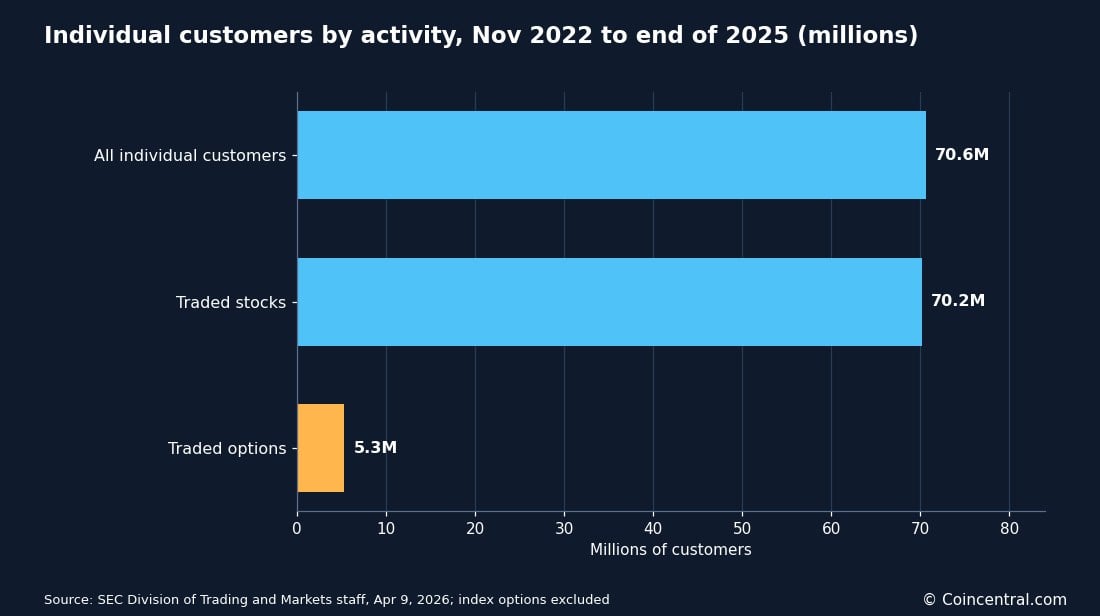 Figure 4: Individual customers by trading activity, in millions, from November 2022 to the end of 2025.
The SEC counts customer IDs, which is the closest thing to a head count. A person with accounts at three brokers counts once, and a joint account can count twice. The method also leaves out index options such as SPX.
FINRA’s 2024 Investor Survey, published in December 2025, found that 21% of U.S. investors with money outside retirement accounts had ever bought or sold options. The figure was 19% in 2021. Another 43% said they have an account that allows options trading.
FINRA also found that 34% of U.S. adults hold investments outside retirement accounts. Multiplying the two figures gives a rough estimate that 7% of U.S. adults have ever traded options. That is a calculation, not a number FINRA publishes.
Fewer new people are joining. SEC staff found that new individual customers entering options ran at 25,000 to 44,000 a month from mid-2022 through 2023. The count topped 50,000 in May 2024, then fell below 30,000 a month by late 2024 and kept falling through 2025. Volume kept rising, which suggests people already trading are doing more of it.
Who Trades Options
Younger investors are far more likely to have traded options. In the FINRA survey, 43% of investors under 35 had done so, compared with 24% of those aged 35 to 54 and 10% of those 55 and older.
Men were more likely than women to have traded options (24% versus 17%). They were also more likely to have an options-enabled account (48% versus 36%).
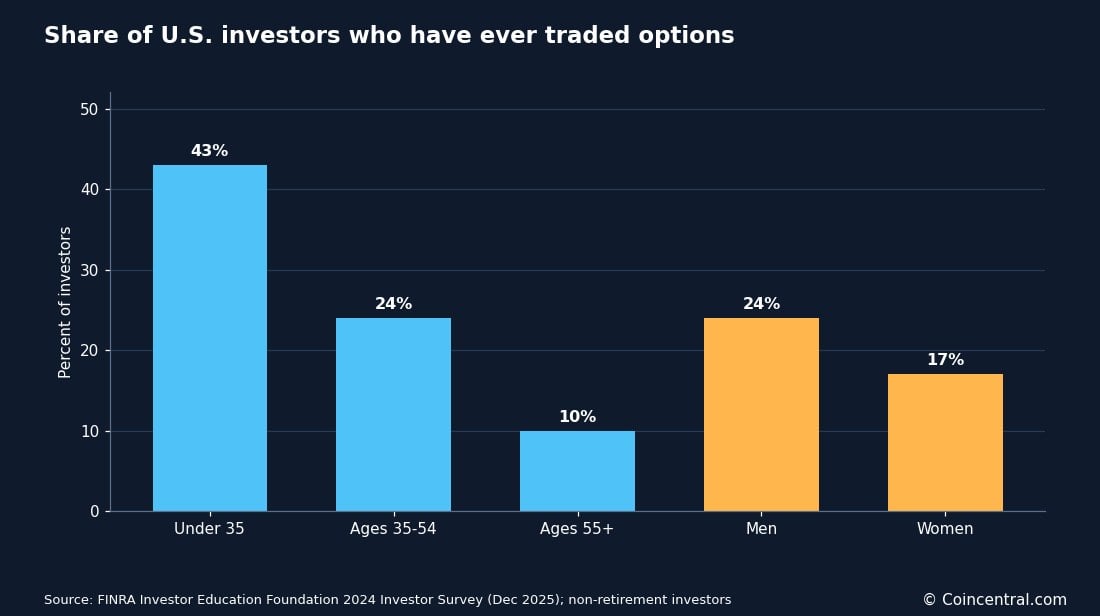 Figure 5: Share of U.S. investors who have ever traded options, by age group and gender.
| Under 35 | 43% | Not reported here |
| Ages 35 to 54 | 24% | Not reported here |
| Ages 55 and older | 10% | Not reported here |
| Men | 24% | 48% |
| Women | 17% | 36% |
Understanding is limited. Only 12% of U.S. investors answered a basic call option question correctly in the same survey, and half said they did not know. The question asked what a call with a $50 strike is worth on expiration day with the stock at $40. The answer is $0.
Among investors who have traded options, 22% got it right and 54% got it wrong.
Trade size is shrinking, which fits with more small accounts. Trades of 10 contracts or fewer rose to 30.2% of industry volume by August 2025, from 27.4% in January 2023. Odd-lot trades rose from 57% to 66% over the same period, according to MEMX data reported by Walnut.
What Share of Options Trading Is Retail?
Retail traders account for roughly half or more of U.S. options volume, depending on who measures it. There is no single official figure.
The numbers differ because each source counts something different. Some track retail broker order flow, some use older academic data, and some count individual accounts while leaving out market makers and index options.
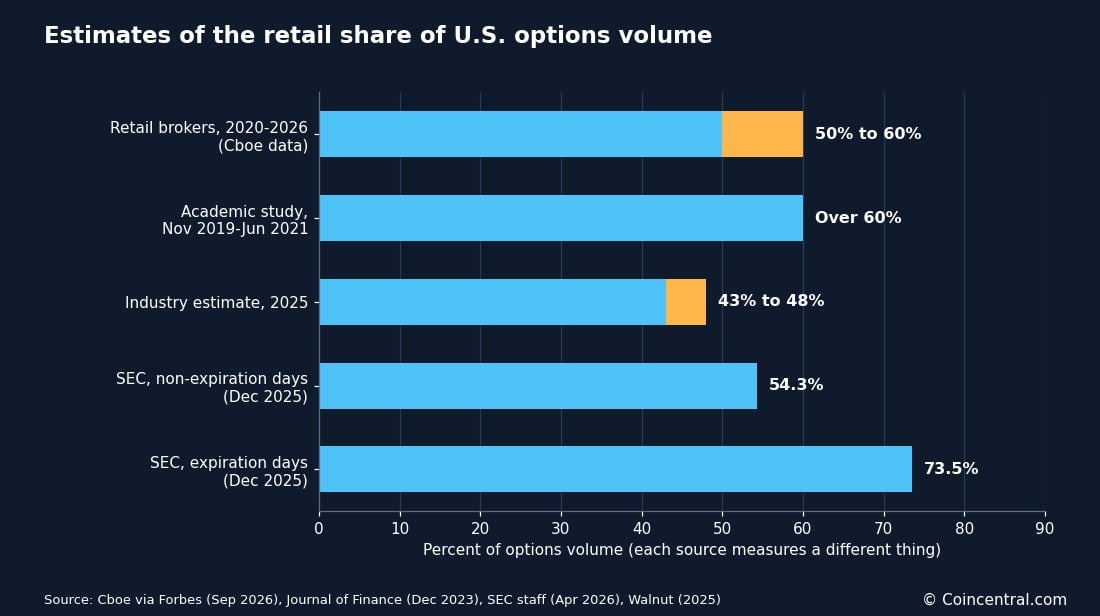 Figure 6: Estimates of the retail share of U.S. options volume. Each source uses its own method and period.
| Cboe data, cited in a Cboe-sponsored Forbes piece (Sep 2026) | Retail brokers’ share of volume since 2020 | 50% to 60% |
| Journal of Finance (Dec 2023) | Trades from Nov 2019 to Jun 2021 | Over 60% |
| SEC staff (Apr 2026) | Non-market-maker volume, non-expiration days, Dec 2025 | 54.3% |
| SEC staff (Apr 2026) | Non-market-maker volume, expiration days, Dec 2025 | 73.5% |
| Industry estimates via Walnut | Daily options volume, 2025 | 43% to 48% |
| MEMX, via CoinLaw | Retail brokers on the MEMX Options venue, Aug 2025 | About 27% |
The SEC figures exclude index options. The MEMX figure covers one trading venue, so it is not a market-wide share.
Retail activity moved with market events in 2026. Cboe said activity in accounts with less than $25,000 rose in Q2, after the Pattern Day Trader rule was repealed. Retail order flow then reached all-time highs in September, according to Cboe, as reported by Traders Union.
Cboe executives also pointed to a jump in simple order counts, which are single options trades rather than spreads. They described it as a sign of broader retail engagement, according to Reuters.
How Popular Are 0DTE Options?
Zero-days-to-expiration (0DTE) options expire the same day they trade. They were 24.1% of all U.S. listed options volume in 2025, or about 14 million contracts a day. That is up from 21.5% in 2024 and almost double the 2022 share, according to Traders Magazine citing OCC and Cboe data.
In the first half of 2026, 0DTE volume topped 20 million contracts a day, up 46.2% year to date, per Cboe. In Q3 2026, 0DTE volume hit a record 24.2 million a day, about 36% of all options volume.
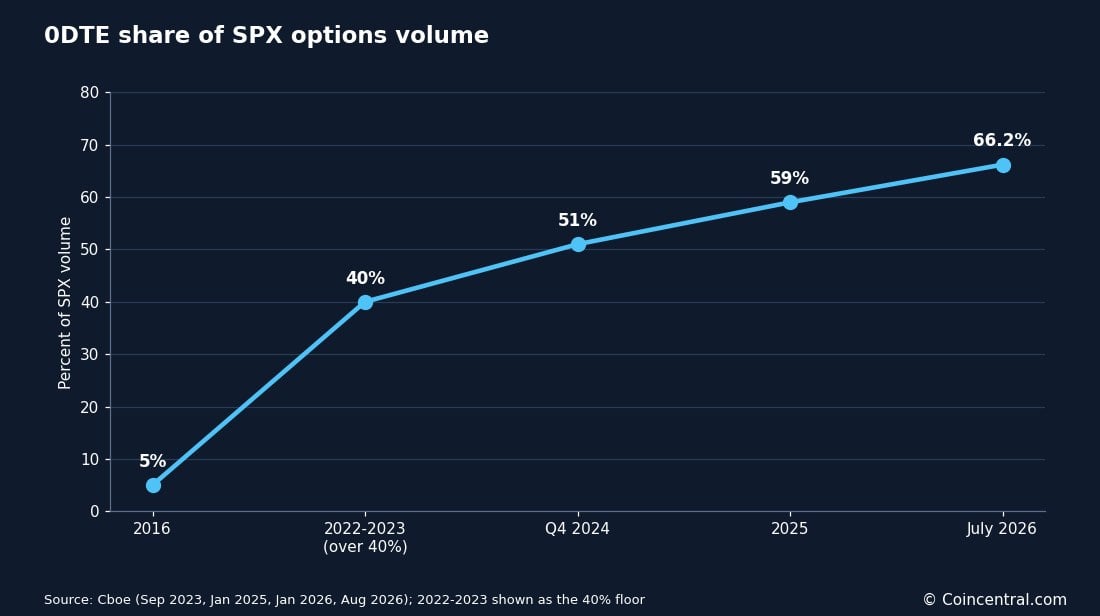 Figure 7: 0DTE share of SPX options volume, 2016 to July 2026. The 2022 to 2023 point is the 40% floor Cboe reported.
| 2016 | 5% | Cboe, Sep 2023 |
| 2022 to 2023, after Tuesday and Thursday expirations were added | Over 40% | Cboe, Sep 2023 |
| Q4 2024 | 51% | Cboe, Jan 2025 |
| 2025 | 59%, or 2.3 million contracts a day | Cboe, Jan 2026 |
| July 2026 | 66.2%, a record | Cboe, Aug 2026 |
Walnut, citing Cboe, reports that SPX 0DTE hit a record 3.2 million contracts a day in Q3 2026, out of 4.9 million SPX contracts. That is about 65%. Cboe’s Q3 data, as reported by Traders Union, puts 0DTE at 56% of all index options volume.
Retail traders made up an estimated 53% of SPX 0DTE volume in August 2025, according to Cboe. A working paper by Beckmeyer, Branger and Gayda found that more than 75% of retail trades in S&P 500 index options were 0DTE in 2022 and 2023.
Most SPX 0DTE trades have limited risk. Over 95% were long options or spreads with a known maximum loss, and only 4% were naked short options, per Cboe (May 2025). A capped loss can still be the whole position in a single day.
Same-day expirations are also spreading to single stocks. Monday and Wednesday expirations in names such as Tesla, Nvidia, Apple, Amazon and Meta now approach 6 million contracts a day combined, according to Cboe.
What Percentage of Options Expire Worthless?
About 22% of options expire worthless, according to the Options Industry Council (OIC), an investor education group funded by the OCC. It says that historically more than 72% of options are closed before expiration and about 6% are exercised.
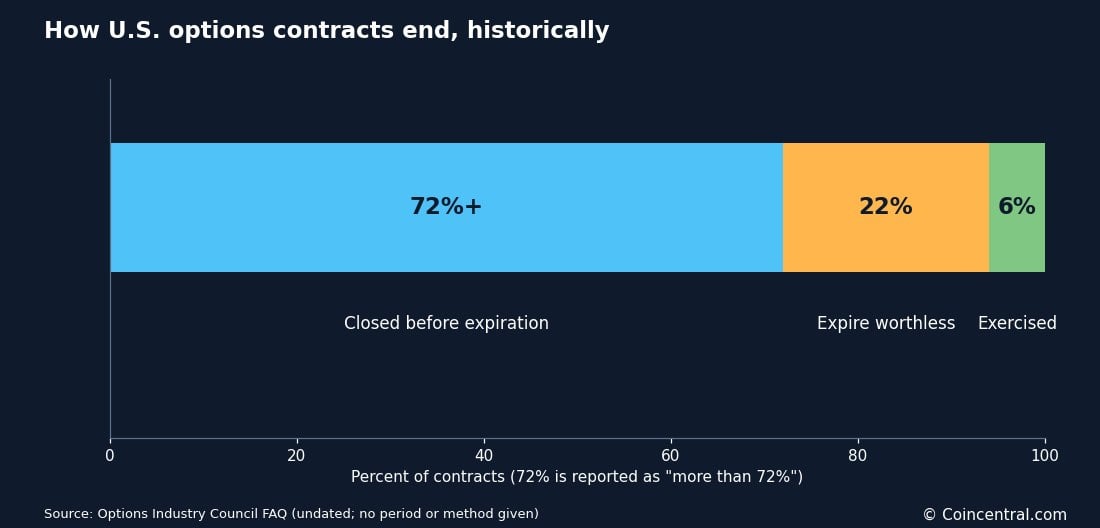 Figure 8: How options contracts end, historically, according to the Options Industry Council.
The OIC page is undated and gives no method. It also does not say whether the shares refer to contracts traded or contracts open at expiration. Treat it as a rule of thumb.
The popular claim that 80% or 90% of options expire worthless has no primary source that we could find. A figure often credited to Cboe, which splits outcomes into 10% exercised, 55% to 60% closed and 30% to 35% worthless, also could not be traced to a Cboe page.
Expiring worthless also does not show who made money. Most positions close early, and a seller can buy back a short option at a loss days before expiration.
Do Retail Options Traders Lose Money?
Retail options traders lost money on average in each U.S. study we reviewed, and trading costs were a large part of it. We found no U.S. regulator that publishes the share of options traders who lose. The common claim that 90% of options traders lose money has no primary or peer-reviewed source that we could find.
| Bryzgalova, Pavlova and Sikorskaya, Journal of Finance, Dec 2023 | U.S. retail options trades, Nov 2019 to Jun 2021 | Lost about $2.1 billion in total and paid $6.4 billion in trading costs versus the midpoint |
| de Silva, So and Smith, Review of Finance, 2026 | Retail option buys before earnings, 2010 to Feb 2021 | Lost 5% to 9% on average around earnings, and 10% to 14% around the most volatile; about $3 billion in total |
| Beckmeyer, Branger and Gayda, working paper, Dec 2023 | Retail SPX 0DTE trades, Feb 2021 to Sep 2023 | Lost $241,000 a day on average, and $350,000 a day after May 2022 |
| Bogousslavsky and Muravyev, working paper, Aug 2024 | 5,182 traders using a trading journal, 2020 to 2022 | The average option trade returned -0.9%, about the size of trading fees |
These figures should not be added together. The $2.1 billion assumes a 10-day holding period, and the $3 billion is scaled up from a sample covering about a quarter of option activity. The working papers had not been peer reviewed at these versions.
Costs matter. Retail investors favored cheap weekly options with an average bid-ask spread of 12.6% from November 2019 to June 2021. Market-wide, the median effective spread at the end of 2025 was 1.9% on single-stock options and 1.4% on ETF options, per SEC staff.
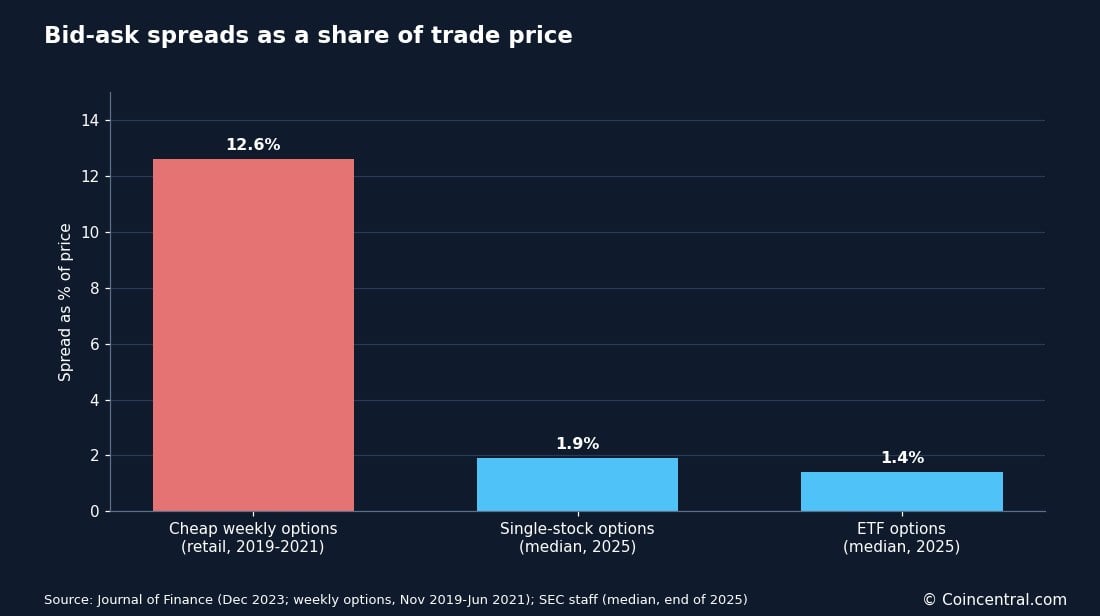 Figure 9: Bid-ask spreads as a share of trade price. The weekly options figure covers a different period than the SEC medians.
Order type also affects cost. In December 2025, individual customers’ marketable single-leg options orders got price improvement 0% to 13% of the time, depending on spread width. Their non-marketable limit orders got it 80% to 99% of the time, according to SEC staff.
A separate study reported by Walnut puts the average effective spread paid by retail traders above 23%. Spread estimates vary by method, product and period.
Do Option Sellers Do Better Than Buyers?
In the trader-level research we found, sellers did better on average. In data on 5,182 retail traders from 2020 to 2022, naked option sales made up 13% of trades and earned 20% on average. Option purchases lost 3.95%.
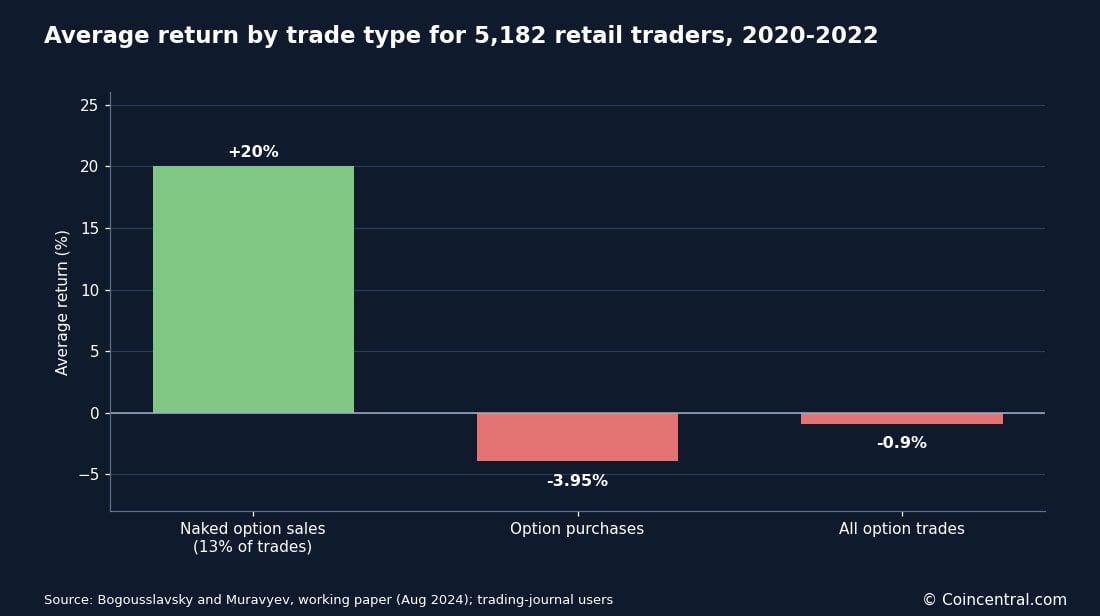 Figure 10: Average return by trade type for 5,182 retail traders using a trading journal, 2020 to 2022.
Those traders used a trading-journal service, and the authors describe them as relatively sophisticated. They may not represent all retail traders.
Selling premium tends to win often and can give back a lot when it loses. A high win rate does not show the full picture unless the average win and average loss are shown beside it.
In 0DTE trading, the Beckmeyer, Branger and Gayda paper found that losses came mainly from single-leg, premium-paying and high-volatility trades. Multi-leg trades did better, although they also lost money on average.
Q3 2026, Longer Hours and What Comes Next
Options trading eased in the third quarter of 2026. Cboe reported average daily volume of 70.6 million contracts, down 4% from the record second quarter, according to Traders Union.
Single-stock options fell 8% to 32.7 million a day and index options slipped 3% to 6.1 million. ETF options rose 1% to 28.3 million. FLEX options set a record at 2.33 million a day.
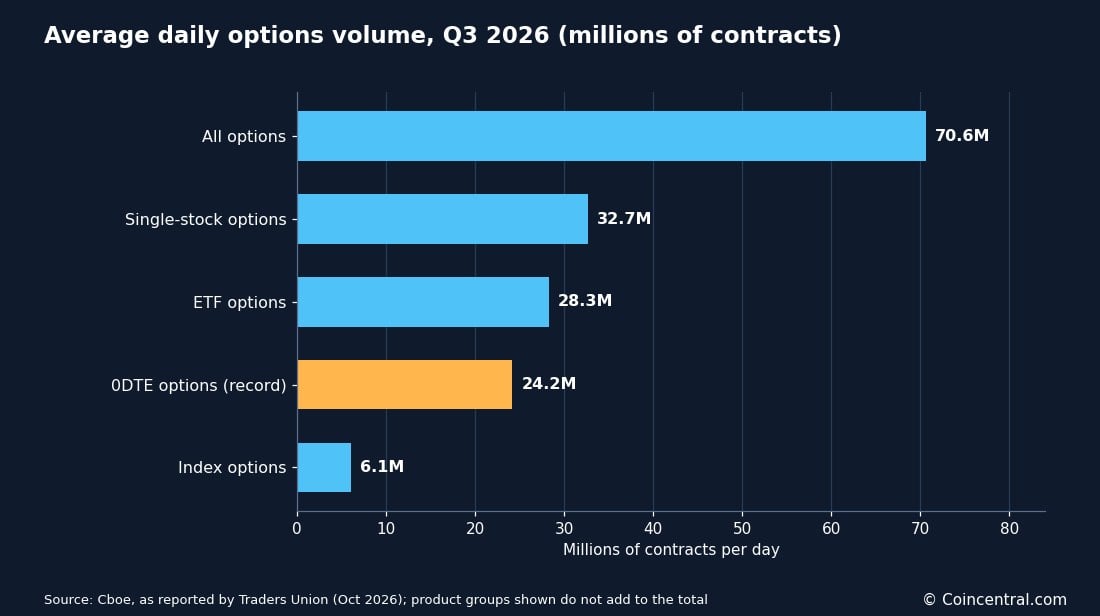 Figure 11: Average daily options volume in Q3 2026, in millions of contracts. Product groups do not add to the total.
Trading hours are also growing. Overnight Global Trading Hours in SPX, XSP, VIX and RUT set a September record of nearly 288,000 contracts a day, almost 3% of index options activity. Cboe also began pre-market trading from 7:30 a.m. to 9:25 a.m. ET for options on 27 stocks and ETFs. Those names account for 53.4% of market volume.
The New York Stock Exchange said it will open options trading for about two hours before the 9:30 a.m. ET open and for 15 minutes after the close. NYSE and Nasdaq also plan to extend stock and ETF trading to 23 hours a day, five days a week, starting December 6, according to Dow Jones.
Duke University finance professor Campbell Harvey said liquidity at midnight will be thinner than at noon, which could widen spreads. Traders who use the new hours may pay more per contract than they would during the regular session.
The industry now has 20 options exchanges across six operators, after two launched near the end of Q3. With daily volume above 70 million contracts and trading hours expanding, the next test is whether activity holds as markets move.
Sources
- Cash Flow University: Options Trading Statistics 2026, Traders, Volume and Losses
- Cboe: State of the Options Industry, Options Market Continued to Break Records in Q2 2026
- Traders Union: Cboe Reports Q3 Options Volume Shifts Toward Index and ETF Contracts
- CoinLaw: Retail Options Trading Statistics 2026, Volume and Trends
- Walnut: Options Trading Statistics (2026)
- Morningstar and Dow Jones: NYSE Just Extended Options Trading Hours. It’s Only the Beginning.
- Reuters: Cboe Exceeds Profit Expectations as Volatility Spurs Options Trading Boom
The post Options Trading Statistics 2026: Volume, Retail Traders and 0DTE Data appeared first on Blockonomi.
What's Your Reaction?
 Like
0
 Dislike
0
 Love
0
 Funny
0
 Wow
0
 Sad
0
 Angry
0









Comments (0)