

What Is 'Red September'? Bitcoin's Curse, and Why Wall Street Has the Same One

In brief
- Bitcoin has closed 8 of the last 13 Septembers in the red, averaging a 2.97% loss, the worst month of the year by both average and median return.
- September 2025 broke the streak with a 5.16% gain, Bitcoin's third straight green close, only for October to turn negative for the first time since 2018 days before a Trump tariff threat triggered $19 billion in liquidations.
- Bitcoin opens September 2026 around $77,500 after a near 25% jump in August, with the Fed weighing its first hike since 2023 and a midterm election year stacking its own seasonal drag on top.
Bitcoin investors have lost money in eight of the last 13 Septembers. The S&P 500 has averaged a loss in September since 1945, and researchers at Yardeni have traced the pattern all the way back to 1928.
Bitcoin didn't invent this curse, but still the digital asset has joined it.
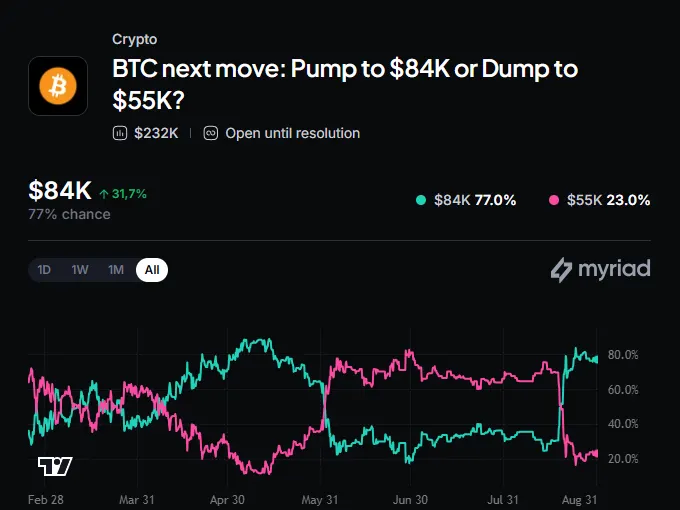 Myriad: Bitcoin price next move? Click to make your prediction.
Crypto traders call it "Red September," a cyclical market boogeyman of sorts that resurfaces every year right around now. But it isn't superstition. It's a data pattern stubborn enough that both a fifteen-year-old asset and a hundred-year-old stock index can't shake it.
But why though?
The math behind the curse
Since 2013, Bitcoin has closed September lower eight times out of 13 completed years, a 38.5% win rate, according to monthly return data tracked by CoinGlass. The average return is negative 2.97%, the median is negative 2.44%, and both numbers matter here: a negative median means even a "normal" September loses money, not just a couple of catastrophic ones dragging the average down.
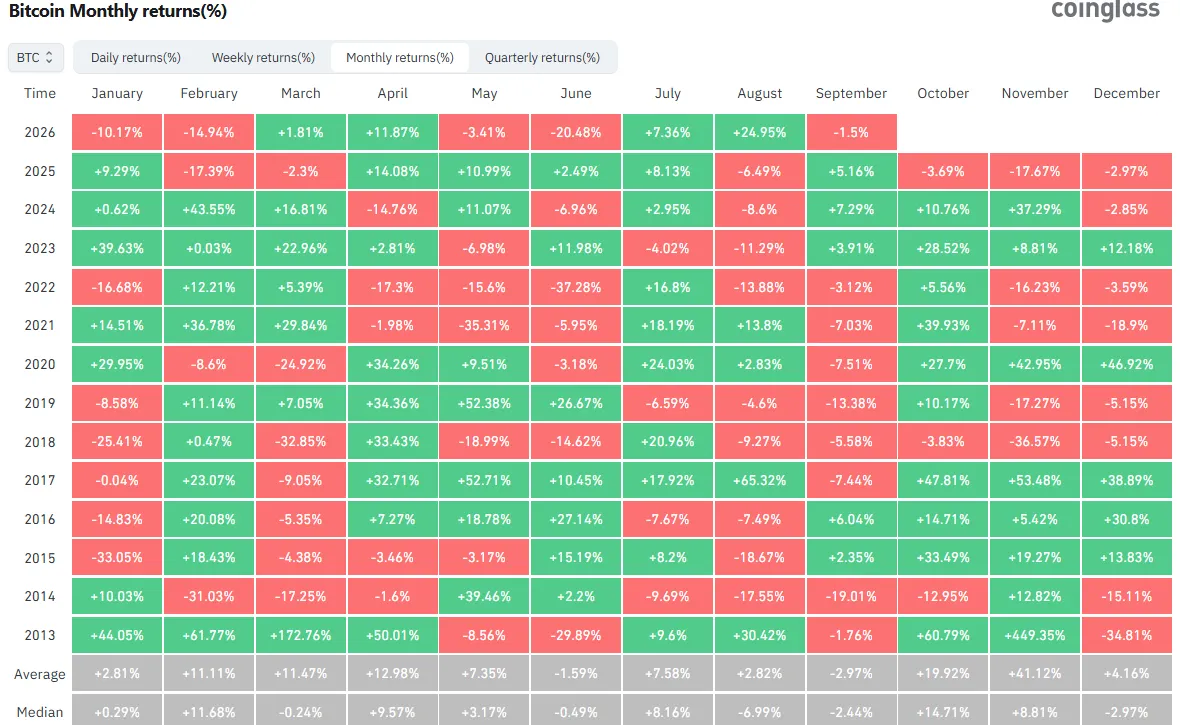 Bitcoin monthly returns. Image: Coinglass
Only June comes close, averaging a smaller 1.59% loss over the same stretch. Everything else on the calendar is positive on average. October, the best month by a mile, has returned 19.92% on average with a 14.71% median, the "Uptober" reputation crypto Twitter always celebrates when the time comes.
August deserves a footnote here, because the number lies. Its average return is a perfectly respectable positive 2.82%, but its median is negative 6.99%. Translation: most Augusts lose money, and it's only the freak years among them that boost the average into positive territory.
It's not just crypto
Wall Street's version of this is older and better documented. The S&P 500 has averaged roughly a 0.6% decline in September since 1945, according to Chase's own market research, and it's the only month with a negative long-run average. Zoom out to 1928 and the number gets worse, closer to a 1.1% to 1.2% average loss.
Nobody agrees on why. The leading theories: mutual funds close their fiscal year on October 31 and dump losers in September to harvest tax losses; institutional desks return from summer break and execute deferred de-risking all at once; and the Fed's mid-month meeting tends to land right in the middle of the chop.
None of those explain Bitcoin, which doesn't have a fiscal year or a summer vacation, but is still a financial investment nonetheless.
This year carries an extra layer. 2026 is a midterm election year, and across the last 10 midterm cycles since 1986, the average U.S. stock market low has landed on September 2, with drawdowns averaging nearly 17% from the prior high before markets recover. Bitcoin trades more like a high-beta tech stock than a hedge these days, so that correlation cuts both ways.
What happened last September
Last year's Red September followed the script, then flipped it. Bitcoin opened the month trading right around $108,000 with its RSI reading oversold near 38, and DYOR CEO Ben Kurland told Decrypt the idea of Red September is "more myth than math."
Math won the early rounds. By mid-month, a brutal week had wiped roughly $162 billion off crypto's total market cap and pushed Bitcoin down toward $112,000, briefly touching an intraday low near $111,986. Myriad, the prediction market built by Decrypt's parent company Dastan, had traders pricing nearly 60% odds of another red day at the bottom.
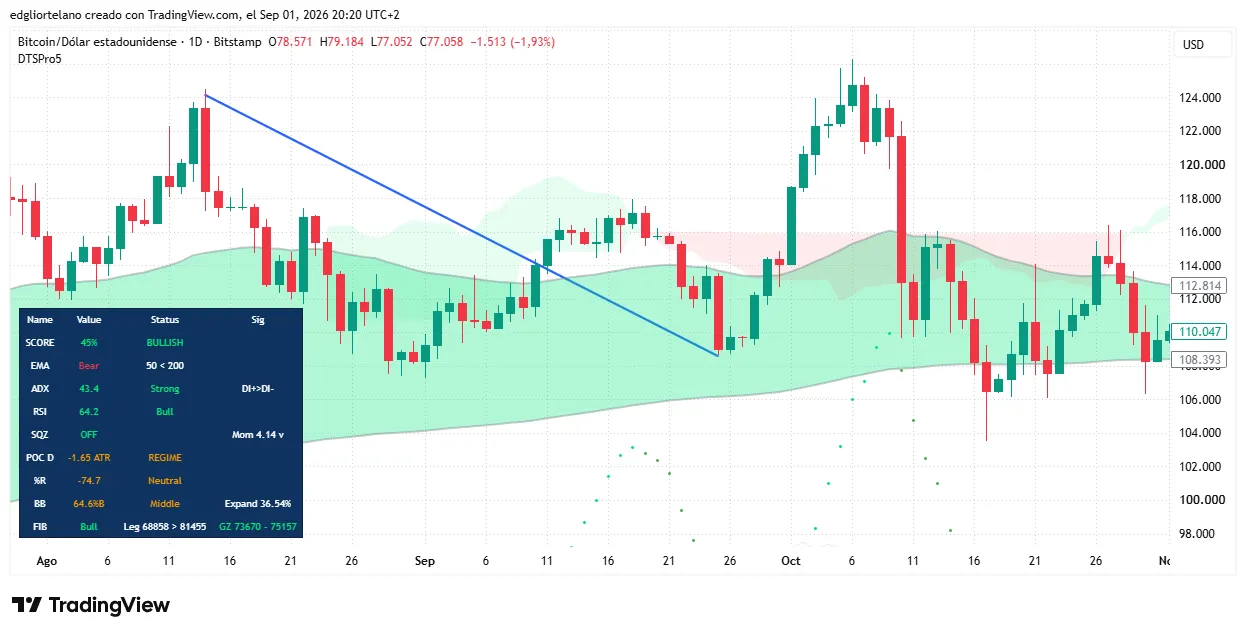 Bitcoin price data. Image: Tradingview
Bitcoin clawed back anyway. ETF inflows played a role. CryptoQuant flagged long-term holders rotating coins into ETFs as a bullish tell, and Bitcoin rallied above $114,000 to close the month up 5.16%, the third consecutive green September on record.
Then October wrecked the party
The redemption arc lasted six days. Bitcoin hit a fresh all-time high above $126,000 on October 6, and the "Uptober" trade looked bulletproof again.
It wasn't. On October 10, President Donald Trump threatened 100% tariffs on Chinese imports, and crypto became the only market open to react. Within 24 hours, $19 billion in margin positions were wiped out, 1.6 million traders got liquidated, and market maker Wintermute told Decrypt it stopped trading entirely because the move broke its own internal risk rules.
Bitcoin fell from above $121,000 to briefly below $102,000 that day, dragging altcoins down even harder. Some layer-2 tokens lost 70% within hours. October closed down 3.69%, only the third red October since 2013, and the damage kept compounding: November finished down 17.67%, Bitcoin's worst November since 2018, on its way to a 21-month low near $59,300 by this past June. Crypto traders have taken to calling that stretch the crypto winter.
So last year was atypical. We had Uptember and Red October, which is not how the market universe tends to behave.
Bitcoin's setup this time
Bitcoin is trading around $77,500 as September opens, down slightly on the day after closing out a nearly 25% August, its best August since 2021. That rally has stalled just under resistance between $81,455 and $82,538, with support sitting in the $73,670 to $75,157 zone underneath.
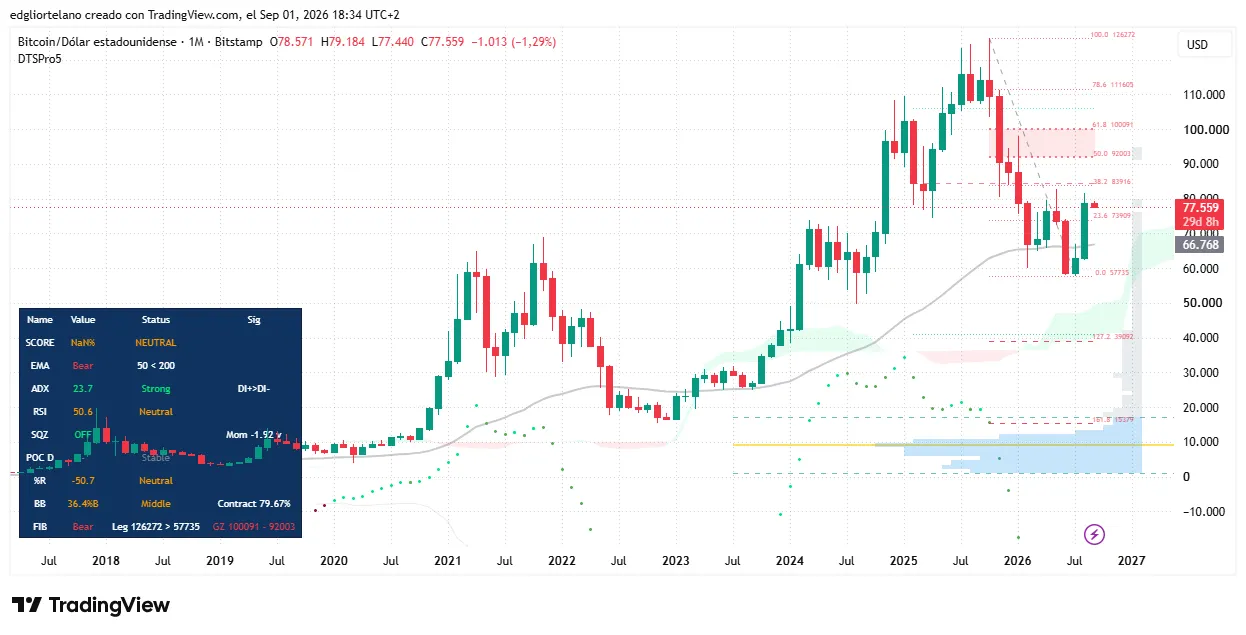 Bitcoin price data. Image: Tradingview
The macro picture has flipped hard since spring. Fed Chair Kevin Warsh used his first Jackson Hole speech to flag that the PCE price index is running 3.7% annually and accelerating on a six-month basis, and CME’s FedWatch tool now put the odds of a September rate hike at 68.2. The 30-year Treasury yield touched 5.28% in late August, a level last seen before the 2008 financial crisis.
Gold has been rallying right alongside Bitcoin, which tells you something about what's actually driving this: not risk appetite so much as a growing debasement trade, investors hedging against a Fed that might be forced to keep printing while inflation refuses to cooperate. The SEC's proposed Regulation Crypto Assets rule, published August 18, adds a rare regulatory tailwind to an otherwise jumpy setup.
The next hard date is September 15 to 16, when the Fed decides whether to hike rates for the first time since its 2022-2023 tightening cycle, a stretch that dragged Bitcoin down roughly 65% to a $15,500 low in November 2022.
Disclaimer
The views and opinions expressed by the author are for informational purposes only and do not constitute financial, investment, or other advice.
Daily Debrief Newsletter
Start every day with the top news stories right now, plus original features, a podcast, videos and more.
What's Your Reaction?
 Like
0
Like
0
 Dislike
0
Dislike
0
 Love
0
Love
0
 Funny
0
Funny
0
 Wow
0
Wow
0
 Sad
0
Sad
0
 Angry
0
Angry
0











Comments (0)