

Bitcoin Price Analysis: Is a Drop Below $60K Next After BTC’s Latest Rejection?
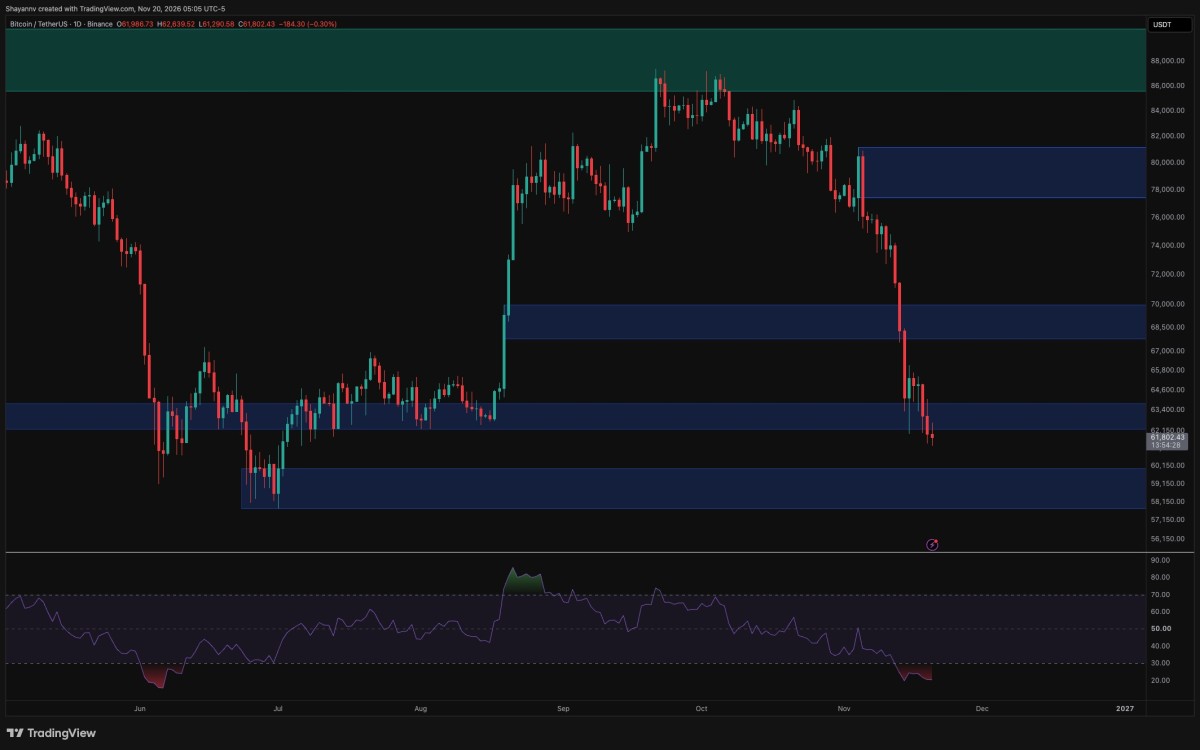
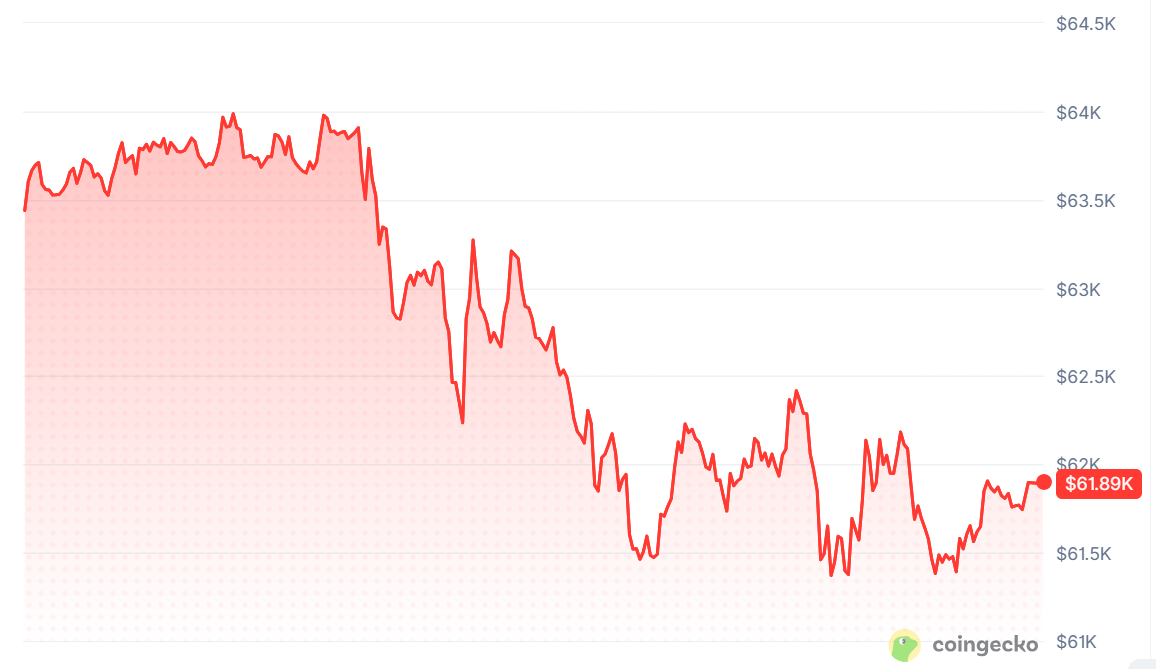
Bitcoin remains under pressure near $61.8K after losing another daily support zone. Deeply oversold momentum leaves room for a relief rally, but buyers have yet to interrupt the bearish structure as price approaches major demand around $60K.
Bitcoin Price Analysis: The Daily Chart
The daily chart shows a sustained decline following Bitcoin’s rejection from the $77.5K–$81K supply zone. Selling accelerated through the $67.8K–$70K demand area, and price has now slipped beneath the former support band around $62.2K–$63.7K.
This latest breakdown leaves the $57.8K–$60K demand zone as the next significant support area. The zone contains the June lows and could attract buying interest, although the current sequence of lower highs and lower lows suggests that sellers retain control.
The daily RSI is hovering near 20, reflecting deeply oversold conditions. This creates scope for a corrective bounce, but does not confirm exhaustion. Recent candles have yet to show the sustained bullish follow-through needed to support a reversal.
Reclaiming $62.2K–$63.7K would be the first meaningful improvement and could allow a recovery toward $64K–$65.5K. Conversely, continued rejection beneath former support would keep a test of $60K in focus. A decisive loss of the lower demand zone would signal further deterioration.
BTC/USDT 4-Hour Chart
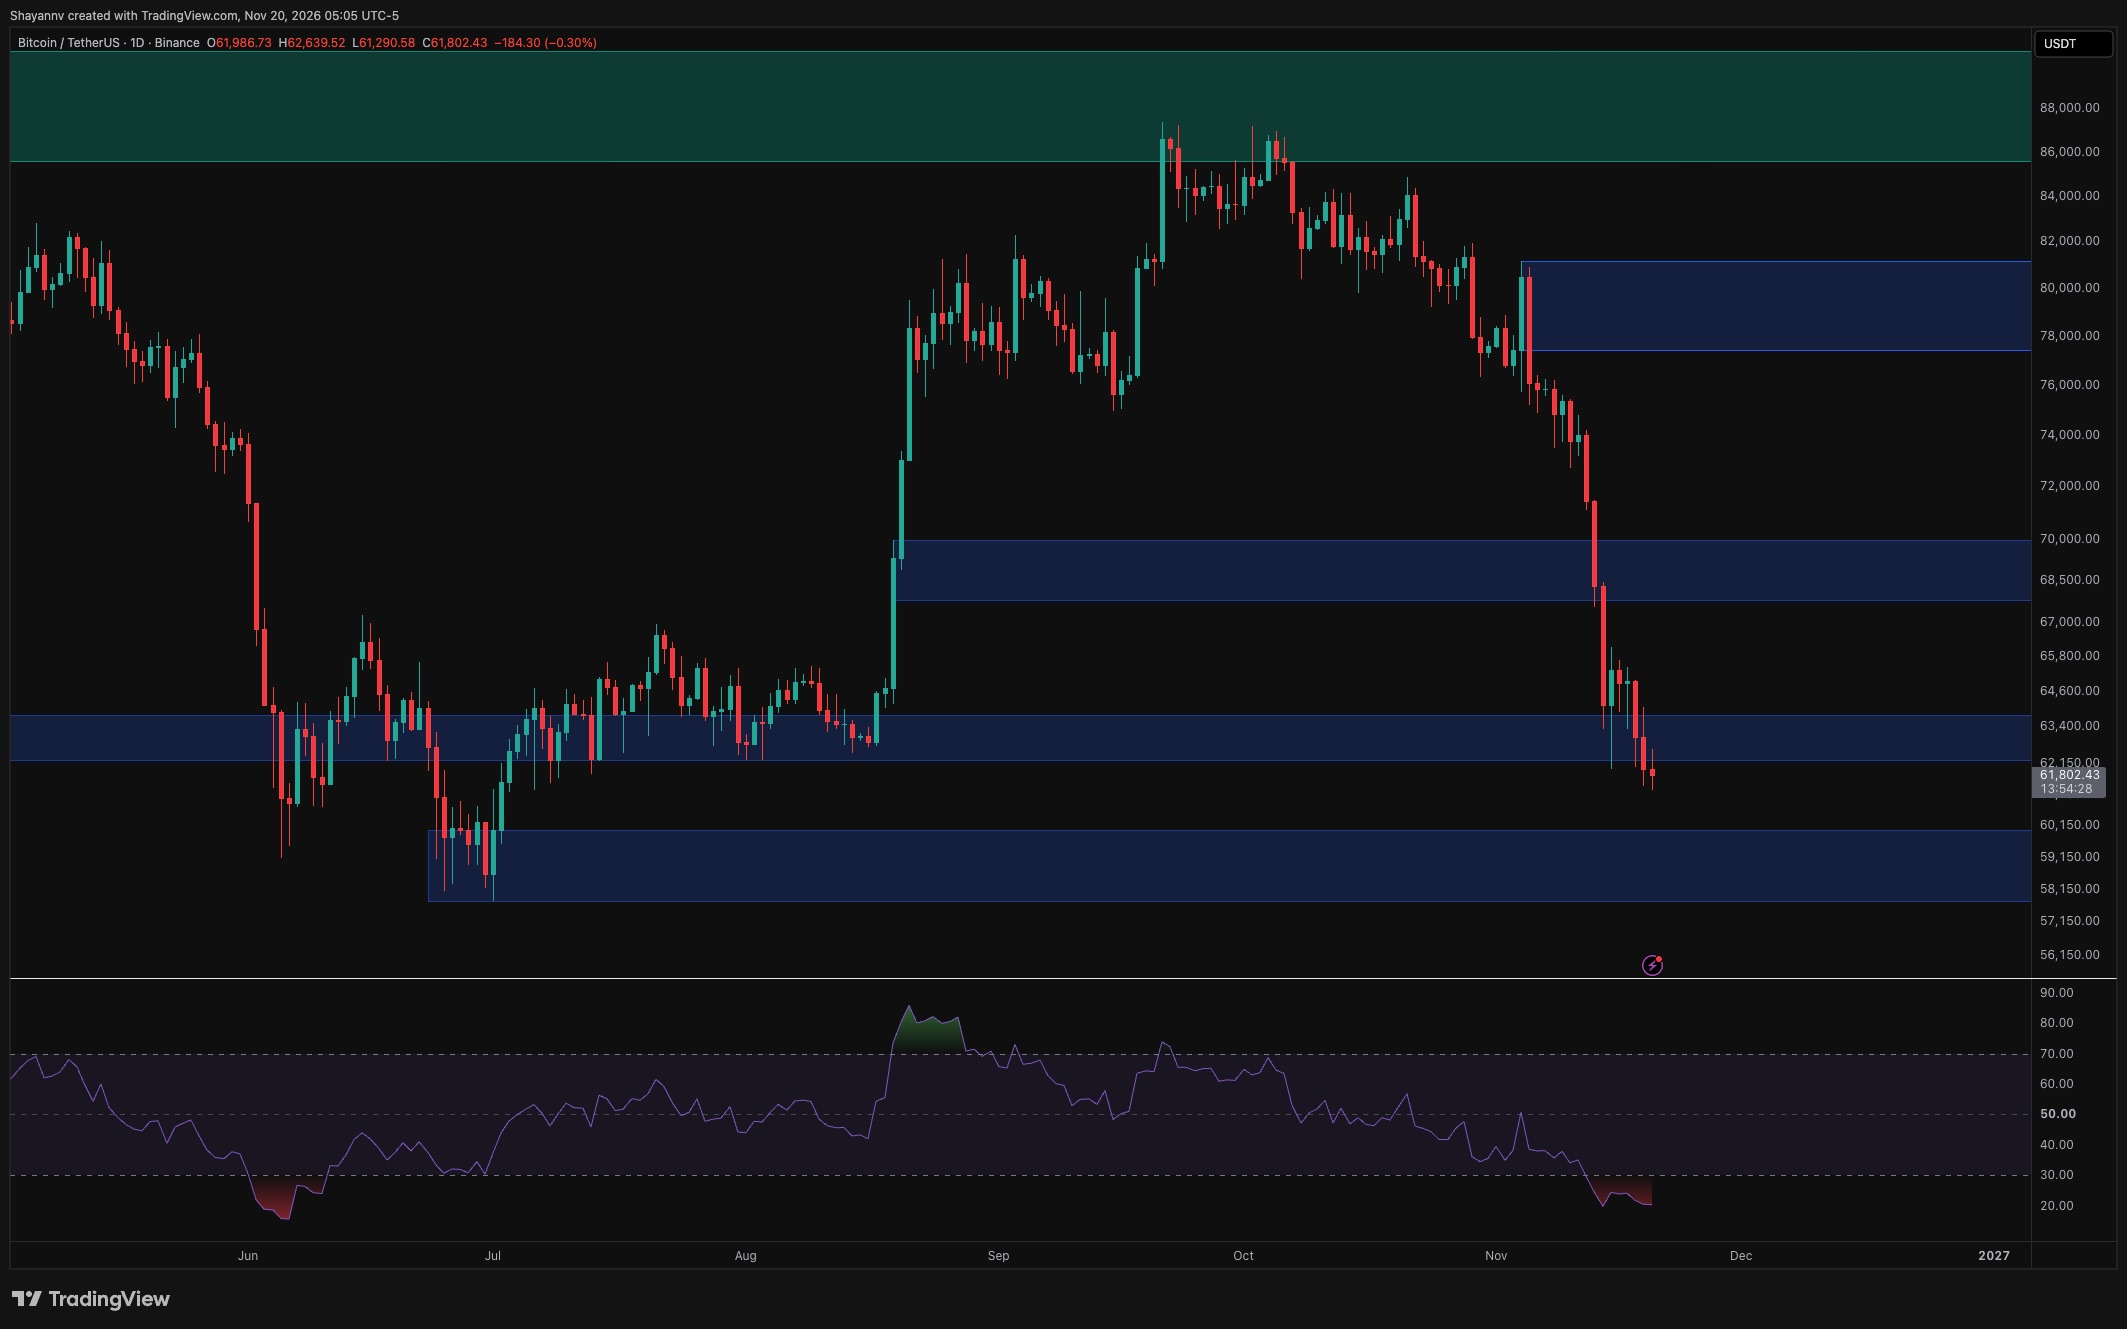
On the four-hour timeframe, Bitcoin continues to form lower highs, with the latest recovery toward $64K followed by another decline toward $61K–$62K. Smaller candles near the lows indicate a pause in selling, but there is no clear bullish structure shift yet.
The immediate downside reference is the recent low around $61.1K–$61.3K. Losing this area would expose the upper boundary of demand near $60K, followed by the remainder of the $57.8K–$60K support zone.
For buyers to gain traction, Bitcoin first needs to recover the recent lower high around $64K and then overcome the consolidation around $64.5K–$65.5K. Sustained acceptance above those levels would weaken the immediate bearish continuation setup.
The marked $72.7K–$74.7K supply zone remains a distant recovery barrier. Together with lower demand, it defines the broader area highlighted on the chart, although price has yet to establish a sideways trading range between those boundaries.
Sentiment Analysis
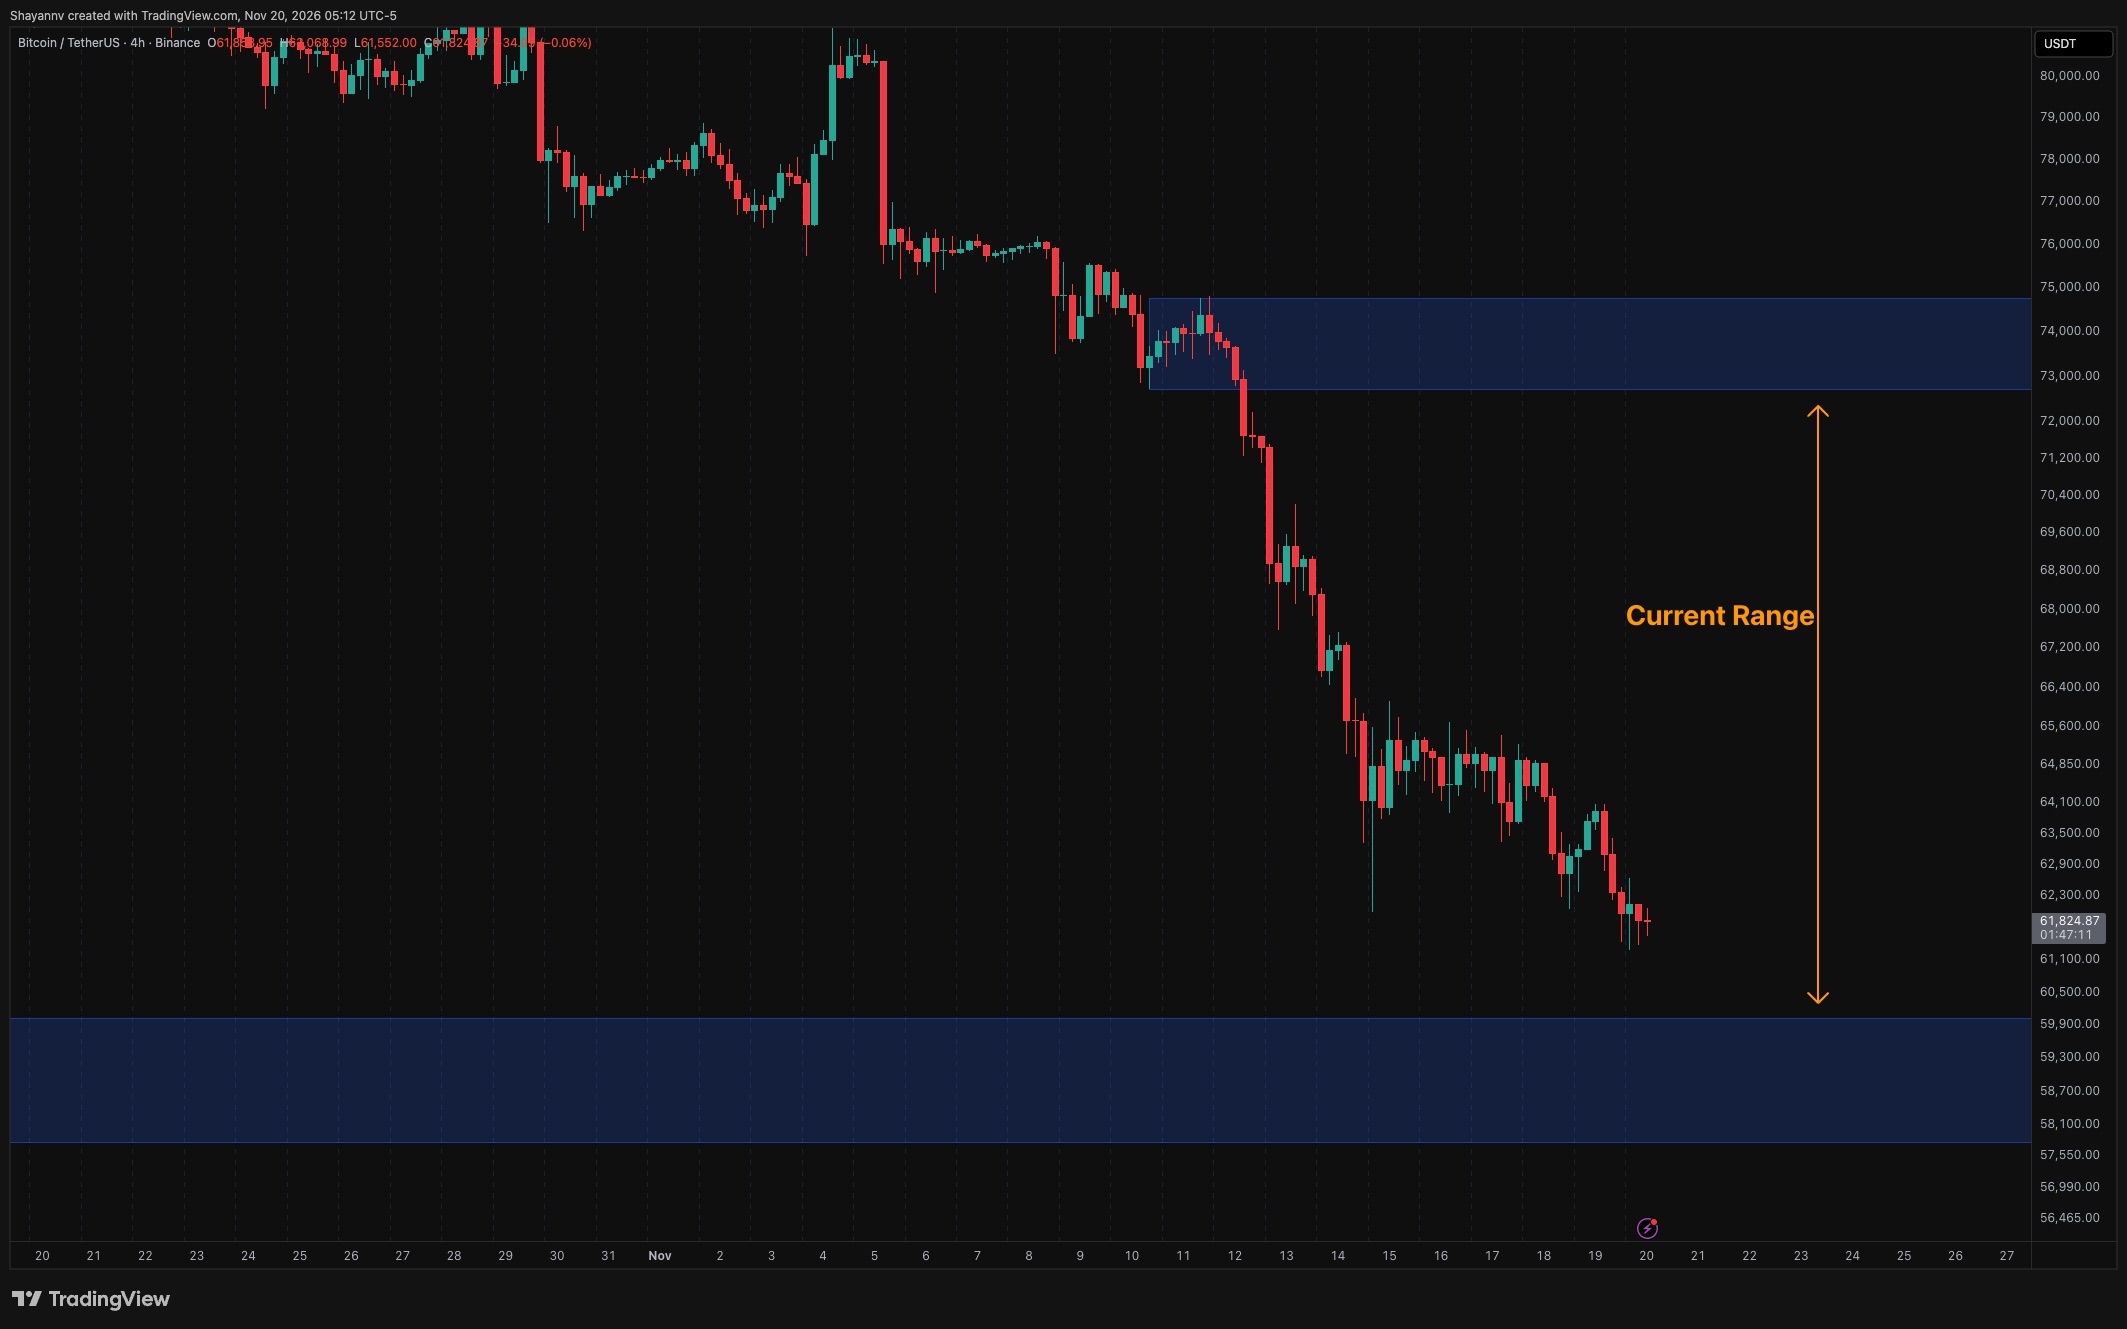
The one-week liquidation heatmap highlights a bright concentration of estimated liquidation exposure beneath the current price, around $60.8K–$61.2K, with additional bands extending toward $60K. These levels could become relevant if Bitcoin loses its nearby lows.
The buildup is consistent with leveraged long exposure vulnerable to another downside move. However, the heatmap alone cannot confirm an increase in net long positioning. A sweep through these bands could trigger forced closures and accelerate selling before any meaningful support response develops.
Above the market, nearby concentrations sit around $62.7K–$63K and $64.3K–$64.7K. A larger concentration spans approximately $65.5K–$68K, creating potential for a sharper recovery if buyers reclaim resistance and trigger short liquidations.
For now, nearby downside exposure aligns with the weak technical structure. A sustained recovery above the broken daily support zone would provide stronger evidence of stabilization than oversold momentum or liquidation concentrations alone.
The post Bitcoin Price Analysis: Is a Drop Below $60K Next After BTC’s Latest Rejection? appeared first on CryptoPotato.
What's Your Reaction?
 Like
0
 Dislike
0
 Love
0
 Funny
0
 Wow
0
 Sad
0
 Angry
0










Comments (0)