Ethereum (ETH) Struggles Below $1,700: Key Technical Levels to Watch

Key Takeaways
- Ethereum currently sits around $1,670, posting a modest 1% gain over the past day while maintaining bearish technical signals
- Technical analysis reveals a bear flag formation constraining upside potential below the $1,700 threshold
- Bulls need a decisive move above $1,700 to target $1,850–$1,900; downside breakdown could revisit $1,500
- Approximately 500,000 ETH tokens valued at roughly $800 million exited centralized exchanges in the past week
- Spot Ethereum ETF products recorded $16 million in net redemptions on Thursday, marking the third consecutive session of outflows
Ethereum’s price action reveals tentative stabilization following recent declines, though bearish momentum continues to dominate the technical landscape. The second-largest cryptocurrency by market capitalization currently hovers around $1,670, registering slight positive movement of approximately 1% in the 24-hour window.
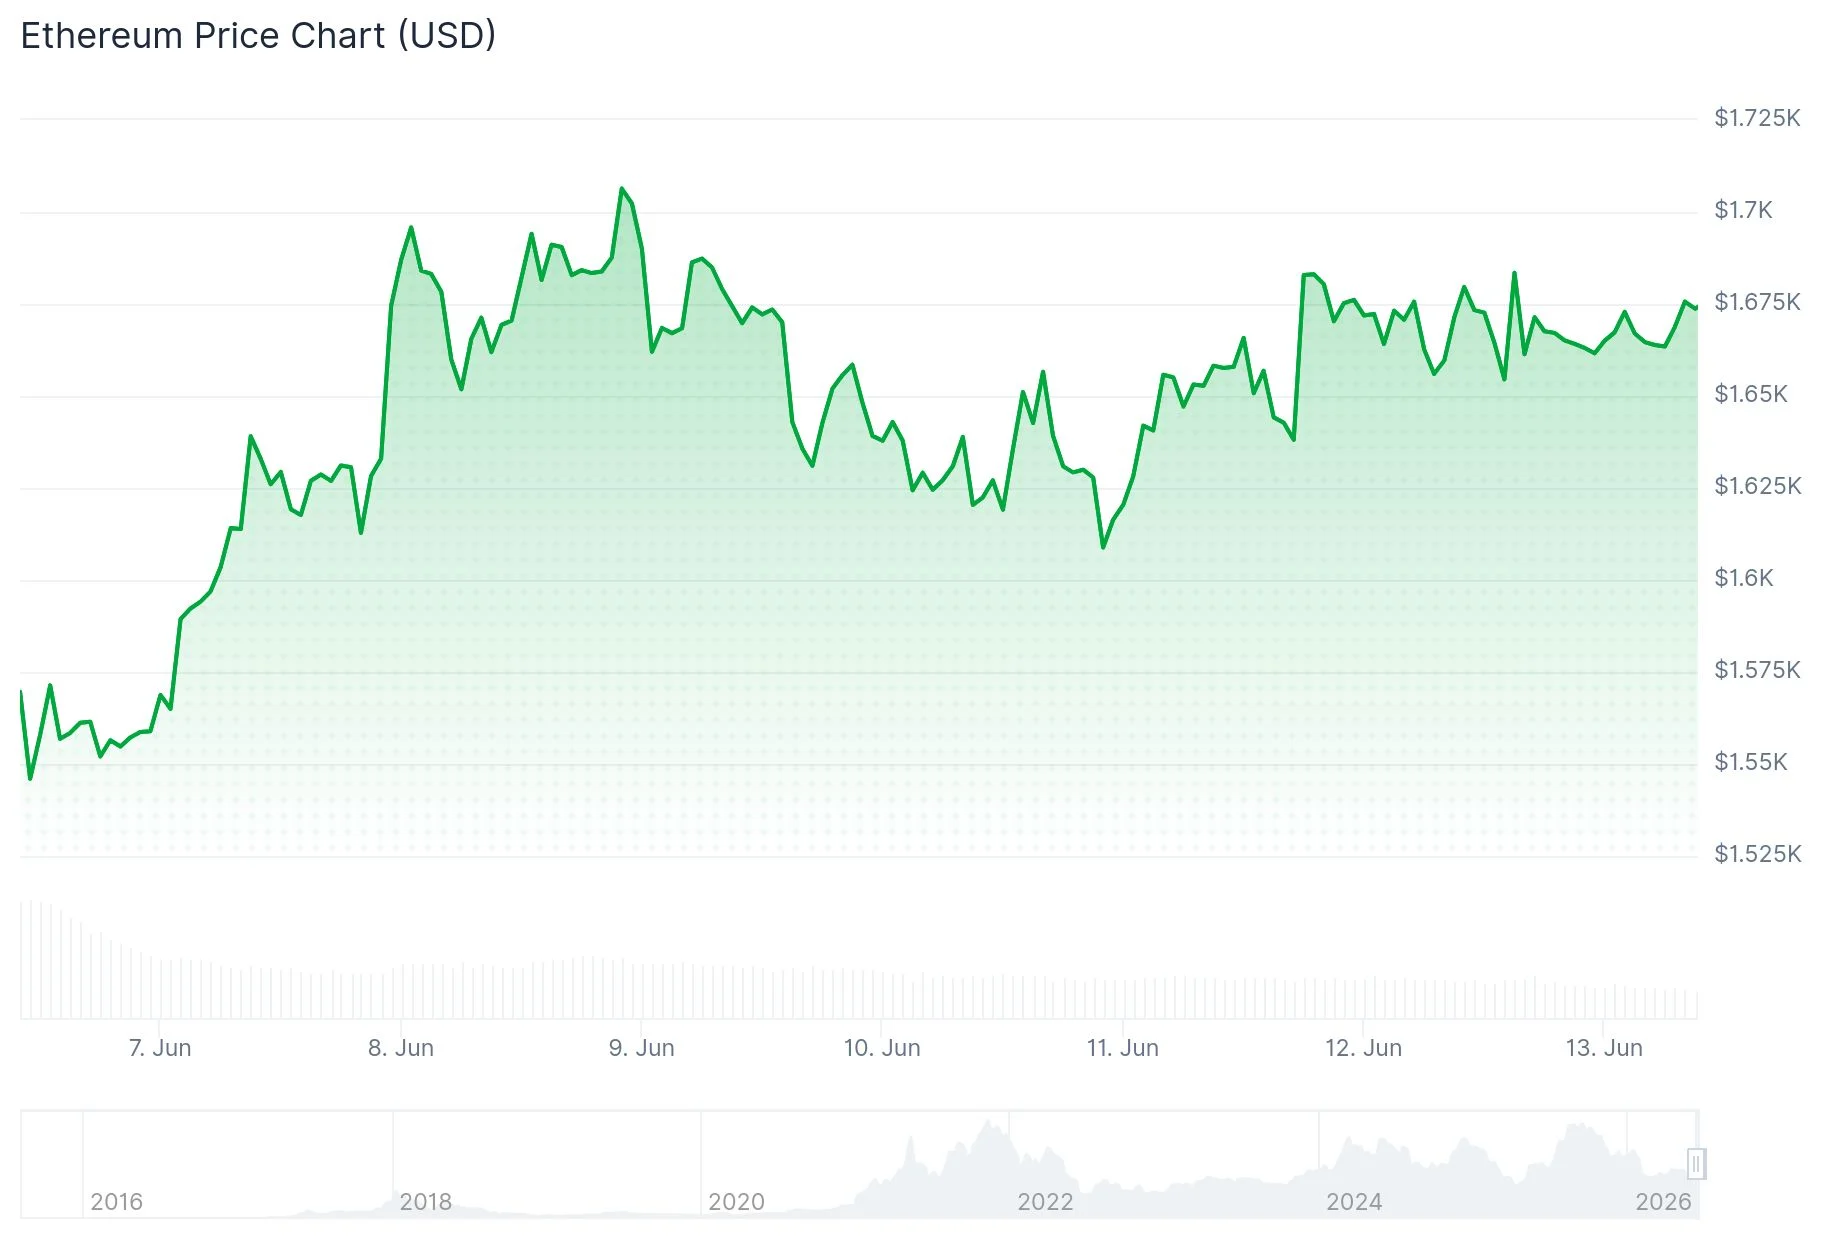 Ethereum (ETH) Price
This marginal uptick follows substantial losses that began in mid-May, fueled predominantly by escalating geopolitical tensions and broader macroeconomic headwinds. The current bounce appears tentative and lacks the conviction needed for a sustained reversal.
Market technician Ted highlighted that ETH remains confined within a bear flag configuration. This particular chart pattern traditionally indicates additional downward pressure unless price action decisively escapes the formation’s boundaries.
$ETH is still trading within this bear flag.
A breakout above the $1,700 level is needed for a move towards $1,850-$1,900.
Otherwise, the chances of Ethereum sweeping lows around $1,500 will go up. pic.twitter.com/8UpAbRYzFi
— Ted (@TedPillows) June 12, 2026
For Ethereum to fundamentally alter its trajectory, a convincing daily close above the $1,700 resistance zone becomes essential. Successfully clearing this technical hurdle could unleash momentum toward the $1,850–$1,900 price range.
Should resistance at $1,700 prove insurmountable, the probability of renewed downside increases substantially. Under such circumstances, traders would likely refocus attention on the $1,500 support threshold.
Significant Exchange Outflows Suggest Potential Accumulation Phase
Cryptocurrency analyst Ali Charts highlighted via social media platform X that approximately 500,000 ETH tokens — representing roughly $800 million in value — departed centralized trading venues during the previous seven-day period. Substantial token migrations away from exchanges frequently suggest investors are transferring holdings into self-custody solutions, which market participants often interpret as preparatory accumulation behavior.
Blockchain metrics provide additional perspective on current market dynamics. Active Ethereum wallet addresses declined to approximately 480,000 on Thursday, retreating from 554,000 in recent sessions and substantially below the 738,000 figure recorded in late April.
Declining network participation during attempted price recoveries indicates the rally lacks widespread engagement across the user base. Such divergences between price and fundamental activity metrics frequently precede correctional moves.
Investment Product Redemptions Compound Selling Pressure
Ethereum-focused exchange-traded fund products have experienced three consecutive sessions of net capital withdrawals. Thursday’s redemptions totaled $16 million, following $41 million and $36 million in outflows on Tuesday and Wednesday respectively.
Derivatives market indicators similarly reflect cautious positioning. Aggregate open interest across Ethereum futures contracts contracted to $22.98 billion on Friday, down sharply from $30.95 billion recorded at June’s beginning.
The Moving Average Convergence Divergence indicator registers approximately -138.24, positioned beneath its signal line at -130.37, confirming sellers maintain market control. Meanwhile, the Relative Strength Index hovers marginally above 30, indicating the asset approaches oversold conditions without yet confirming directional reversal.
ETH currently trades substantially below its 50-day, 100-day, and 200-day exponential moving averages positioned at $2,000, $2,148, and $2,405 respectively. These technical levels constitute formidable overhead resistance barriers.
The most current pricing data places ETH at $1,688, remaining constrained beneath the pivotal $1,700 level with no confirmed bullish reversal signal evident on daily timeframe charts.

What's Your Reaction?
 Like
0
Like
0
 Dislike
0
Dislike
0
 Love
0
Love
0
 Funny
0
Funny
0
 Wow
0
Wow
0
 Sad
0
Sad
0
 Angry
0
Angry
0


Comments (0)