

Cardano (ADA) Price: Token Climbs 11% to Test $0.28 Resistance
TLDR
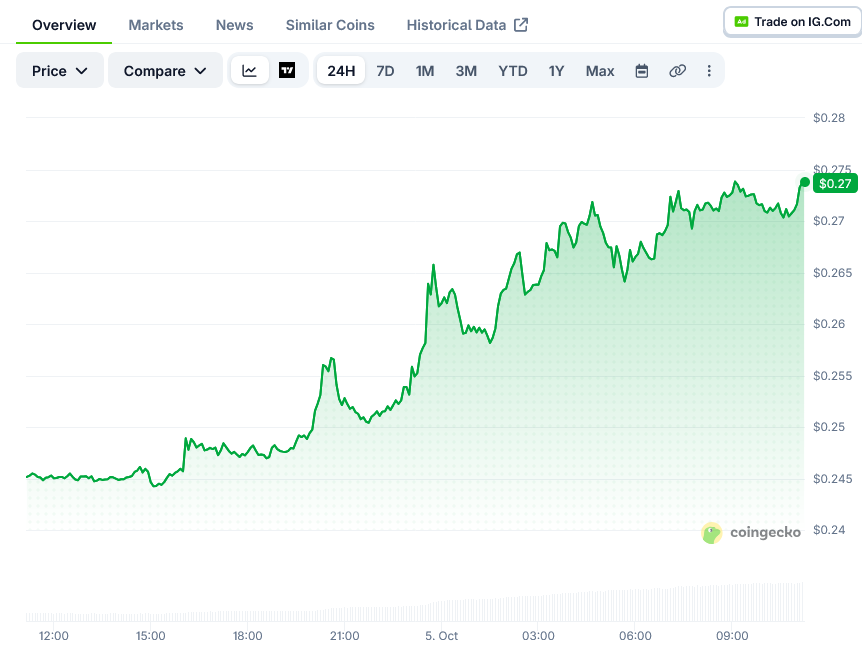
- Cardano (ADA) rose 11% in 24 hours, trading between $0.24 and $0.27.
- The token now faces immediate resistance at $0.28 and strong resistance at $0.29.
- Open interest fell 11.68% during the rally, which points to a short squeeze.
- Stochastics at 93.46 and RSI at 69.66 show overbought conditions.
- Top traders remain 71.9% net long, with $0.25 serving as immediate support.
Cardano (ADA) rose 11% over the past 24 hours, trading between $0.24 and $0.27. The token now sits near $0.27, just below resistance at $0.28.
The move came with real trading activity. Spot volume on Binance reached $84.8 million over the same period.
In recent weeks, Layer-1 tokens like ADA and SOL have moved more sharply than Bitcoin in both directions. That pattern showed up again in this session as market sentiment turned positive.
According to Blockchain.news analysis, the rally pushed out short sellers positioned below $0.26. Price then ran into the upper Bollinger Band at $0.28.
Technical Indicators Show Mixed Signals
ADA is trading above all of its major moving averages. The 7-day simple moving average (SMA) sits at $0.25, the 20-day at $0.24, the 50-day at $0.22, and the 200-day at $0.21.
Momentum readings are less clear. The MACD histogram has flattened at zero, which suggests the buying push behind the rally has slowed.
Cardano Price on CoinGeckoThe Relative Strength Index (RSI) stands at 69.66, just under the overbought level of 70. The stochastic oscillator reads 93.46, which is deep in overbought territory.
ADA’s Bollinger %B is 0.91, meaning price is close to the upper band. The band’s midline is at $0.24, and the pivot point is at $0.26.
The average true range (ATR) is $0.02. That gives ADA room to move about $0.02 in either direction in a single session.
Derivatives Data and Key Levels
Open interest fell 11.68% over 24 hours while price climbed 11%. This means traders were closing positions rather than opening new ones.
The analysis links this to a short squeeze, where short sellers were forced to cover and pushed price higher. Fresh long positions did not chase the move in large numbers.
Positioning still leans bullish. Top traders are 71.9% net long, with a long/short ratio of 2.55, while retail traders are 68.5% long.
The taker buy/sell ratio is 1.135, showing more aggressive buying than selling. Funding rates are neutral at 0.01%.
The analysis gives a 55% chance to a bullish path. In that case, ADA would hold between $0.25 and $0.27 for three to seven days before closing above $0.28, with $0.29 and then $0.32 to $0.34 as targets.
The bearish path carries a 45% chance. Under that view, sellers defend $0.28 and ADA falls back to $0.25 support, with $0.23 as the next support level.
A daily close below $0.25 would cancel the bullish outlook. A close below $0.23 would end the short-term recovery setup.
At the time of writing, ADA traded at $0.27, up 0.18% on the latest one-minute data. The $0.28 level remains the main resistance traders are watching.
The post Cardano (ADA) Price: Token Climbs 11% to Test $0.28 Resistance appeared first on Blockonomi.
What's Your Reaction?
 Like
0
Like
0
 Dislike
0
Dislike
0
 Love
0
Love
0
 Funny
0
Funny
0
 Wow
0
Wow
0
 Sad
0
Sad
0
 Angry
0
Angry
0












Comments (0)