

Chainlink (LINK) Price: LINK Tests Falling Wedge Resistance Near $11.50
TLDR
- LINK is testing a falling-wedge breakout after holding support near $11.10–$11.20.
- A move above $11.40–$11.50 could open the path toward $12.00 and $12.25.
- RSI sits at 41.44, below the neutral 50 line, showing cautious momentum.
- Trading volume rose 14.27% to $414.86 million while open interest fell 3.55%.
- New integrations from ForeverMoney AI and GM Trade expand Chainlink’s network reach.
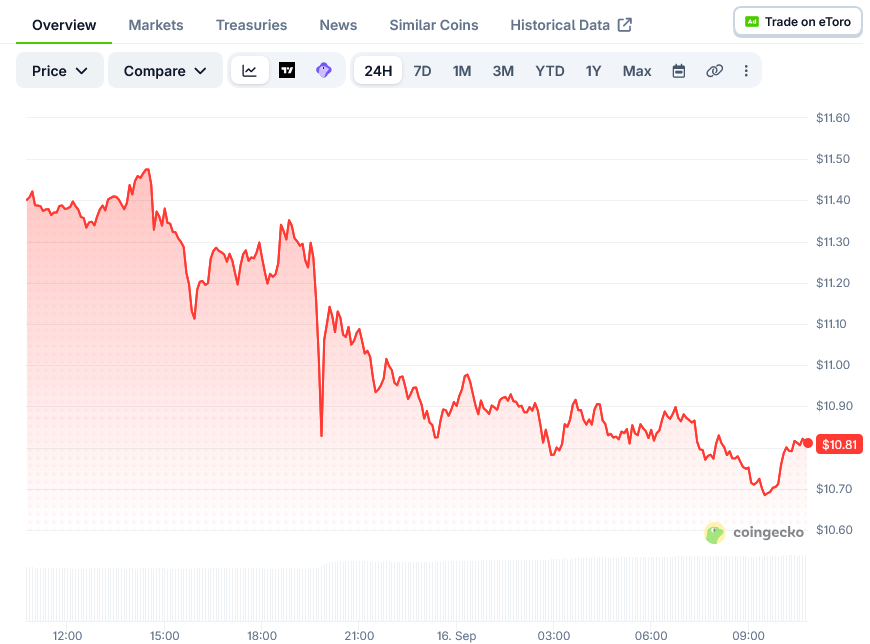
Chainlink’s LINK token is trading near $11.28, sitting inside a falling-wedge pattern on the daily chart. Buyers have defended the $11.10 to $11.20 zone several times over the past few weeks.
That repeated support has kept the wedge structure intact. Traders are now watching whether price can clear the upper boundary of the pattern.
Crypto analyst Trader Symba pointed out that LINK has started pushing against descending resistance after defending its support zone multiple times. Symba said a confirmed break above this resistance could open the door to a stronger recovery for the token.
The first hurdle for buyers sits between $11.40 and $11.50. Clearing that zone would shift focus toward $12.00, with $12.25 as the next level above it.
LINK previously broke above $13.50 during an earlier rally. That move came with a sharp widening of the Bollinger Bands, a sign of higher volatility at the time.
Chainlink Price on CoinGeckoTechnical Signals Stay Mixed
Selling pressure later pushed LINK back down through the middle Bollinger Band and toward the $11.00 area. The token is now trading between the middle and lower bands as volatility contracts again.
RSI tells a similar story of cooling momentum. The indicator climbed close to 80 during the rally, then dropped into oversold territory near 30.
RSI now reads 41.44, still below the neutral 50 line. That places LINK’s momentum in a cautious, undecided range.
Volume and Network Growth Continue
Derivatives data adds another layer to the picture. According to CoinGlass, LINK’s trading volume climbed 14.27% to $414.86 million, pointing to higher short-term participation.
Open interest moved the opposite direction, falling 3.55% to $576.02 million. Rising volume alongside falling open interest suggests traders are adjusting positions rather than adding new leveraged bets.
Outside of price action, Chainlink’s network kept expanding. Chainlink’s official X account announced that ForeverMoney AI is using the CCIP network to bring 1:1 native TAO transfers to Robinhood Chain.
The post highlighted how the integration extends Chainlink’s cross-chain transfer tools into a new trading venue. It marks another use case built on top of the CCIP infrastructure.
Separately, GM Trade integrated Chainlink’s Data Streams to support around-the-clock commodity trading on its platform. That gives traders access to continuous price data outside standard market hours.
These integrations sit apart from the token’s short-term chart setup. They point to continued use of Chainlink’s tools across trading platforms and blockchain networks.
For now, the $11.40–$11.50 zone remains the key resistance to watch. A close above it would put $12.00 and $12.25 in view, while a rejection could send LINK back toward the $11.10–$11.20 support area.
The post Chainlink (LINK) Price: LINK Tests Falling Wedge Resistance Near $11.50 appeared first on Blockonomi.
What's Your Reaction?
 Like
0
Like
0
 Dislike
0
Dislike
0
 Love
0
Love
0
 Funny
0
Funny
0
 Wow
0
Wow
0
 Sad
0
Sad
0
 Angry
0
Angry
0










Comments (0)