

TSLA Stock Compression Puts $390 Support in Focus

TLDR
- TSLA stock gained 0.45% and closed at $396.52 after failing to hold above $400.
- The shares closed below major exponential moving averages, creating resistance between $397 and $404.
- Technical indicators showed mild bearish pressure, but the low ADX reading signaled weak trend strength.
- Traders identified $390 as crucial support, while a break above $404 could improve the technical structure.
- Analysts highlighted bear-trap signals, price compression, and a multi-month symmetrical consolidation triangle.
Tesla stock (NASDAQ: TSLA) closed slightly higher during the latest session, but it failed to maintain an early move above $400. Technical indicators showed weak momentum, while three traders identified competing short-term and longer-term price structures. Consequently, TSLA stock remains within a narrow range as traders assess support, resistance, and possible breakout signals.
Tesla Ends Session Below Key Moving Averages
TSLA stock gained 0.45% and closed at $396.52, according to the latest TradingView market data. The shares opened at $399.05 and reached an intraday high of $402.22. However, sellers pushed the price toward $394.76 before the closing bell.
Tesla finished below its 20-day, 50-day, and 100-day exponential moving averages. Those averages currently sit between $402.31 and $403.64, creating a concentrated resistance area. The shares also closed below the 200-day exponential moving average at $397.29.
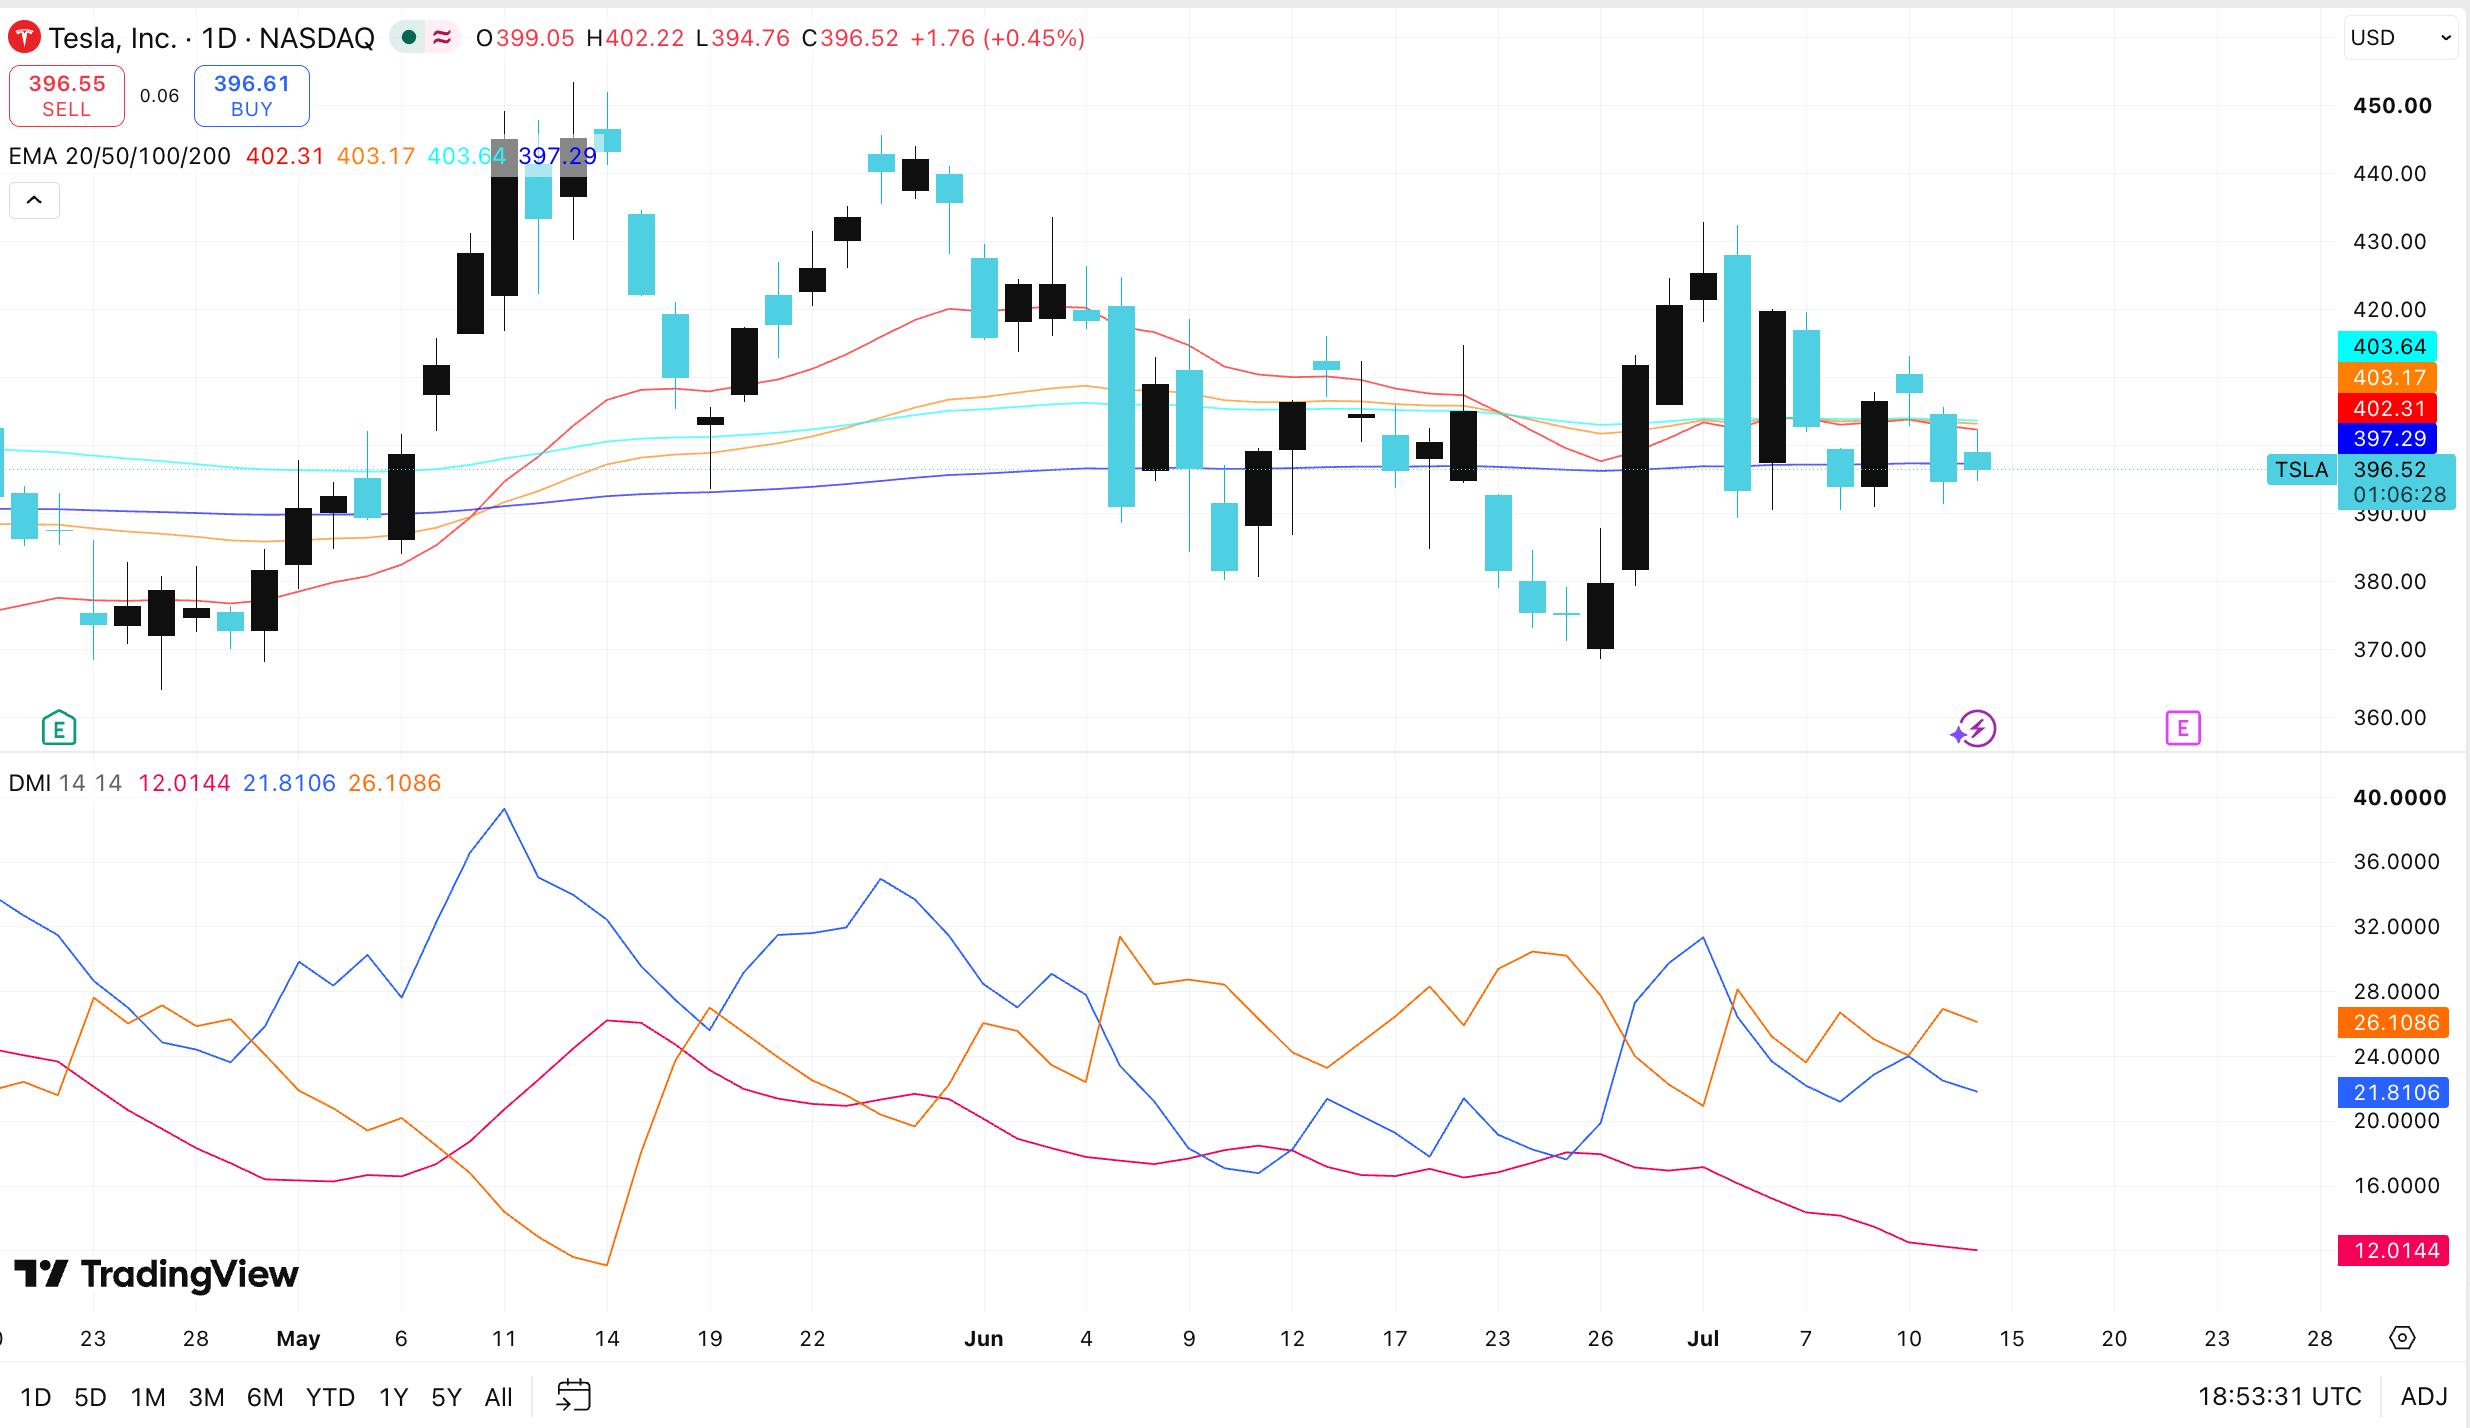
TSLA/USD 24-hour price chart source: TradingView
Immediate resistance now extends from approximately $397 to $404, while nearby support remains at $394.76. A lower support zone sits near $390, which traders identified as an important structural level. Therefore, TSLA stock needs a decisive move beyond either boundary to establish clearer direction.
TSLA stock currently faces mild bearish pressure based on readings from the Directional Movement Index. The negative directional indicator stands at 26.11, exceeding the positive indicator reading of 21.81. That difference shows sellers held a modest advantage during the measured period.
However, TSLA stock recorded an Average Directional Index reading of only 12.01. Such a low reading indicates that neither buyers nor sellers currently control a strong trend. Therefore, price compression could continue until trading activity strengthens around the established boundaries.
A break above $404 would place the shares beyond several closely grouped moving averages. Conversely, a drop below $390 would weaken the current structure and expose lower support areas. Until either event occurs, the stock may continue moving between nearby support and resistance levels.
Traders Outline Different Breakout Scenarios
TSLA stock has also attracted several technical interpretations across different chart periods. CoinvoTrading described the recent decline near $400 as a possible bear trap within a broader psychological cycle. The trader’s daily chart projected a recovery after earlier euphoria, anxiety, and capitulation phases.
 $TSLA HAS JUST FOOLED EVERYONE
The bear-trap on Tesla has fooled thousands of traders already.
MONTH 1-2: Euphoria + optimism.
MONTH 2-4: Anxiety + capitulation.
MONTH 4-7: Recovery + bull trap (here now).
This is where most people fade a stock that is about to explode.… pic.twitter.com/F8golsnPGp
— Coinvo Trading (@CoinvoTrading) July 14, 2026
Meanwhile, @EWTracker placed TSLA stock inside a multi-month symmetrical consolidation triangle. The chart showed the current price near the middle of the formation, rather than either boundary. According to the analysis, repeated trendline tests could delay a confirmed breakout until September or October.
Separately, @optionflys identified compression between descending resistance and rising support on the one-hour chart.
The trader listed $413 and $420 as upside levels, while a fall below $389.90 would invalidate the bullish structure. Overall, TSLA stock remains range-bound after closing at $396.52 and failing to secure support above $400.
The post TSLA Stock Compression Puts $390 Support in Focus appeared first on Blockonomi.
What's Your Reaction?
 Like
0
Like
0
 Dislike
0
Dislike
0
 Love
0
Love
0
 Funny
0
Funny
0
 Wow
0
Wow
0
 Sad
0
Sad
0
 Angry
0
Angry
0











Comments (0)