

Bitcoin Price Analysis: Is BTC Running Out of Steam After Another Rejection at $87K?
Bitcoin is approaching a key resistance area again after recovering from its late-September pullback. The price structure remains constructive, but nearby technical resistance and holder cost bases suggest that buyers still face a meaningful barrier to further gains.
Bitcoin Price Analysis: The Daily Chart
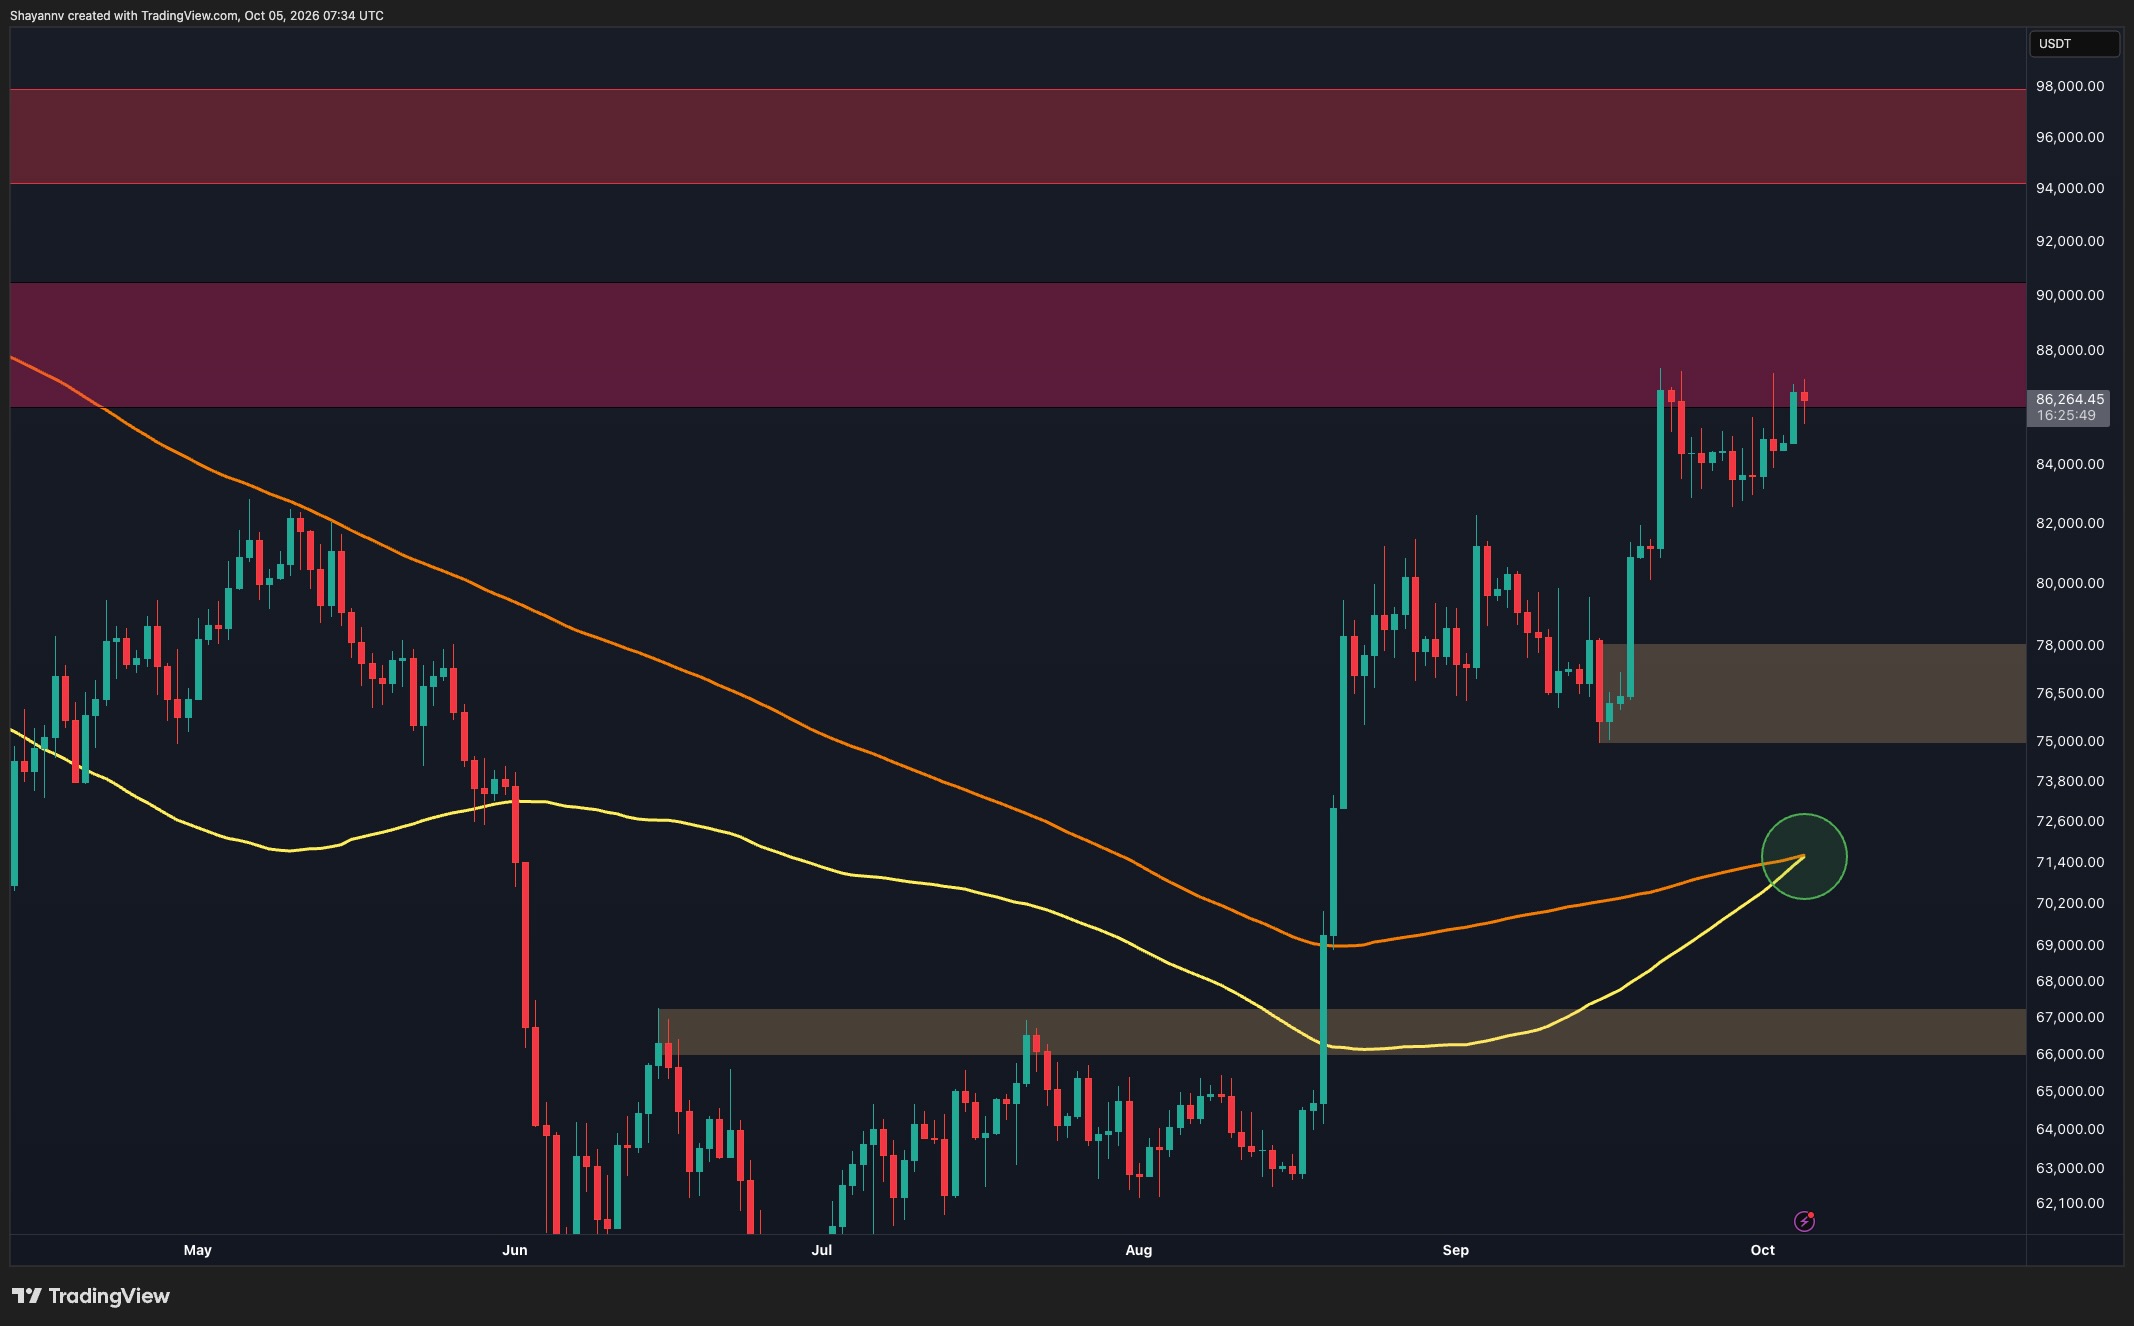
On the daily timeframe, BTC is trading around $85.2K, near the lower boundary of the $86K–$90K resistance zone. Following the initial rejection around $87K, buyers defended the $83K–$84K area and pushed the price back toward the recent highs. This relatively shallow correction suggests that demand remains resilient, although a sustained breakout has yet to materialize.
Meanwhile, the two displayed moving averages are converging around $71.5K, with the rising yellow average approaching the orange average from below. The highlighted potential bullish crossover would reinforce the broader recovery backdrop, but confirmation is still needed, and the asset remains well above both averages.
A sustained move above the recent $87K–$87.5K highs could allow Bitcoin to advance further into the $88K–$90K resistance area. Clearing that broader zone would open the way toward the next major supply region at $94K–$98K. Conversely, another rejection followed by a loss of the $83K support area would increase the risk of a deeper correction, with the $75K–$78K demand zone serving as the main highlighted support below.
BTC/USDT 4-Hour Chart
The 4-hour chart shows an ascending triangle developing within the broader rising channel. Repeated highs around $87K–$87.3K form a relatively flat resistance boundary, while the ascending white trendline supports progressively higher lows. Bitcoin is currently trading near the upper portion of this formation after another test of overhead resistance.
This compression suggests that buyers continue to challenge supply, but the pattern requires a confirmed breakout. A decisive 4-hour close above $87.3K, followed by sustained acceptance above that level, could support a move toward $89K–$90K, where the broader supply zone and upper channel boundary would become relevant.
On the downside, the ascending triangle support currently sits around $84.5K–$85K. Losing this trendline would weaken the continuation setup and expose the recent lows around $82.5K–$83K. Further selling could then bring the broader channel midpoint near $81K into focus, followed by the $75K–$78K demand zone.

Sentiment Analysis
The Realized Price UTXO Age Bands chart tracks the average on-chain cost basis of coins grouped by age, providing context for the profitability of different holder cohorts.
With Bitcoin around $85K, the price remains above the realized prices of the 1-to-3-month and 3-to-6-month cohorts, positioned near $69K and $71K, respectively. These cohorts are therefore in aggregate unrealized profit. However, Bitcoin is still below the closely aligned realized prices of the 18-month-to-2-year and 6-to-12-month cohorts, both near $88K–$89K.
This cost-basis cluster overlaps with the daily resistance zone, adding significance to the $88K–$90K area. As price approaches these levels, some holders may use a return toward breakeven to reduce exposure, potentially increasing selling pressure. The metric alone does not confirm that such selling will occur, but it identifies a region where supply could emerge.
A sustained move above $89K–$90K would place Bitcoin above both cohort cost bases and strengthen the bullish continuation scenario. Until then, the convergence of technical resistance and realized prices remains an important hurdle for the recovery.

The post Bitcoin Price Analysis: Is BTC Running Out of Steam After Another Rejection at $87K? appeared first on CryptoPotato.
What's Your Reaction?
 Like
0
Like
0
 Dislike
0
Dislike
0
 Love
0
Love
0
 Funny
0
Funny
0
 Wow
0
Wow
0
 Sad
0
Sad
0
 Angry
0
Angry
0










Comments (0)